Organic traffic down YoY? It’s not what you think…
It’s been about 18 months now since ITP 2.1 was announced –and over a year since your analytics (or your clients’!) will have really started feeling the impact. Here at Brainlabs, some of our clients have seen a 20% hit in total reported organic traffic due to this Safari update, and often it’s been the last thing anyone has looked to to explain that drop.
In this post I’m going to explain why ITP 2.1 impacts reported organic traffic (and indeed other channels) in Google Analytics (GA), how you can calculate the impact on your site, and share some real world figures from our clients so you can see how you compare.
Wait, what is ITP 2.1?
Oh yeah, sorry – perhaps we should have a quick refresher first. ITP, or Intelligent Tracking Prevention, is a series of updates to Apple’s Safari browser, designed to restrict web tracking and particularly cross-site tracking technologies that users might be uncomfortable with. The Safari browser is a lot more prevalent than you might think (iPhone traffic!), and in any case Chrome and Firefox are generally following in Apple’s slipstream on this, so it’s well worth paying attention to.
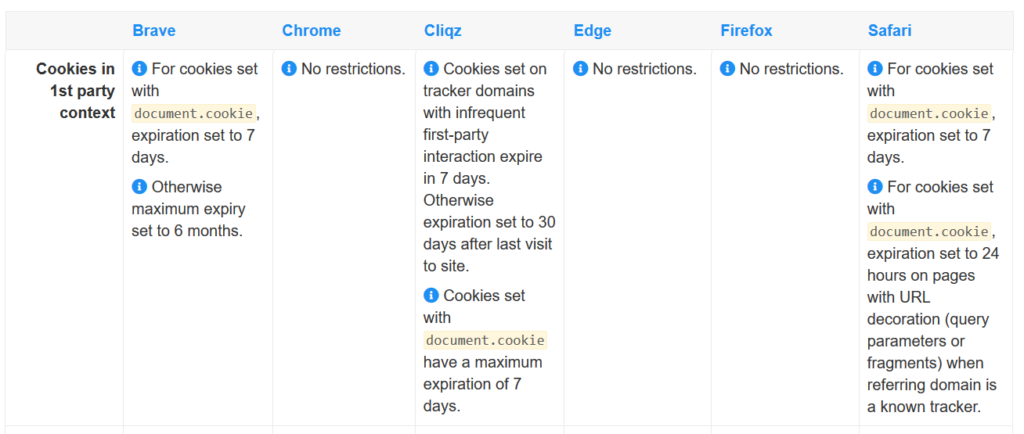
The ITP 2.1 update should be of particular interest to you, as it limited 1st party JavaScript cookies to a 7-day timeout.
Surely, cookies expiring doesn’t mean less organic traffic?
Kinda. It’s true that this change will have no impact on what you see in, for example, Google Search Console.* Your users have not changed their behaviour, but the way that behaviour appears in your analytics data is changing – in a way that is probably less favourable for your KPIs.
However, it’s a different story for Google Analytics (and similar platforms), because of their slightly opaque treatment of direct traffic. Google Analytics default reports and API data all use something called Last Non-Direct attribution.
If you arrive at a site as genuinely direct traffic, but you had a recent, previous session through another channel (e.g. organic), the new direct session is attributed to the previous channel.
Here’s a diagram showing what that might look like:
Example of last-non-direct attribution journey
Cheeky, right? There’s some legitimate reasons for this – a lot of supposedly “direct” sessions are arguably misattributed. There are scenarios in which a supposedly direct session is actually more of a continuation of a previous session (particularly if it’s on the same day), so you can see why Google might want to attribute them to a previous channel. Anyway, let’s not get into the ethics and conspiracy theories right now – the point is that Google Analytics is using some seriously long duration cookies to attribute more sessions to organic, and indeed PPC and other channels, than it would do otherwise.
The default campaign timeout in Google Analytics is 6 months (this can be altered in property settings, but hardly anyone does so). Let’s compare that with the 7-day timeout figure I mentioned earlier.
Cookie expirations

So in a scenario where I discover a site via organic, then return 8 days later via direct:
- A couple of years ago, my second session is organic
- In 2020, it’s direct
There’s actually another metric this has a big impact on – and that’s “returning users”. Cookies expiring earlier means that more users will appear to Google Analytics as “new”. Here’s a chart showing how & when pre-ITP-2.1 versions of Safari faded out of one of our clients’ traffic during 2019:
Pre-ITP 2.1 Safari versions
And here’s how that impacted their rate of reported new/returning users across all browsers – notice how the Safari change is easily noticeable in the total data:
Breakdown of new/returning users during 2019 (all browsers)
*Or at least, no immediate impact – perhaps if your branded display campaigns are affected then that will have some long term impact on branded search volume etc. etc
Great – so how about my reported organic/PPC/social traffic?
So, to recap: the impact on, for example, your reported organic traffic, is going to come about because direct sessions from users with a previous organic session will no longer be recategorised as organic, unless there was less than 7 days in-between.
The extent to which you’ll be underreporting vs historic traffic basically depends on two key variables:
- How much Safari traffic do you get?
- How many of your visitors are returning, but after >7 days?
- (The real question here is how many are returning via direct but are not reported as such, but you probably don’t know that off the top of your head!)
Happily, you can get a precise estimate of the combined impact out of GA itself. The question you need to ask is “What’s the difference between 6-month and 7-day lookback window last non-direct attribution models?”. Simple enough – there’s even a model comparison tool in the interface:
However, there’s two key problems with this method:
- To get an idea of the difference you should expect, you’ll actually need to go back to March 2019 or earlier data – anything more recent already will be reflecting many returning Safari users as “new”, so isn’t useful to us.
- The model comparison tool has a maximum lookback window of 90 days, not 6 months, so we need to compare a 7-day lookback in the tool with default reports for the same time period.
So, here’s an example of the two reports we’d compare:
March 2019 default channel grouping report
Model comparison tool Last Non-Direct, 7-day lookback
And then we need to know the Safari enquiry % for this period (55% in the above example).
So bringing all that together:
- Organic enquiries are at 4,165 vs. 4,671 (-11%)
- Assuming Safari users are a representative sample, this means that with this change they’d report 11% fewer organic enquiries
- 55% of the traffic is from Safari
- So assuming that Safari users are a representative sample of the whole, we can So we can estimate that 55% of our 11% drop will have been felt on the site
- 55% of -11% is -6% (-0.11*0.55)
- 6% underreporting of organic enquiries vs. early 2019
Here’s some more examples from our client base, with Excel-ready formulas:
| Organic conversions from period in early 2019 (model comparison tool) | Organic conversions from same period in early 2019 (default report) | % change | % of conversions from Safari | Estimated underreporting of organic in 2020 vs. early 2019 | |
|---|---|---|---|---|---|
| Formula | X | Y | (X-Y)/X | Z | Z*(X-Y)/X |
| Cosmetic treatment | 4165 | 4671 | -11% | 55% | -6% |
| HR software | 3729 | 3921 | -5% | 28% | -1.3% |
| Ecom | 56296 | 90188 | -38% | 44% | -17% |
As you can see, there’s a huge range there, so I strongly recommend you work this out yourself – but when you do, it might well bail you out of some awkward KPI conversations.
Just to reiterate – this is based on the assumption that Safari users are representative of the whole. I’ve had to do this because the model comparison tool doesn’t allow browser segmentation, but I don’t think it’s a completely ridiculous assumption as these things go.
Can/should I evade this change?
My view is that adjusting for this in your KPIs is the appropriate response, not attempting workarounds for browser’s capabilities, and that’s the conversation I’m having with clients that track long-term organic conversions (or sessions!) and have seen a big impact.
Attempting workarounds not only locks you into a potentially gruelling arms race, but also raises serious ethical questions about defying user expectations. That, however, is a post for another day.
What next?
Well, it’s likely other major browsers will follow suit. Probably Firefox first, although that’s been on the cards for quite a while at this point. I recommend the site cookiestatus.com to follow this:

Competition
I’m keen to see the most extreme ITP 2.1 organic traffic impacts in the wild. Winner gets, er… a Retweet?


