How to create a site speed report on Data Studio based on Chrome User Experience
Site speed audits have always been great at telling my clients how fast their site is performing. But they also need to know whether their efforts to improve it are paying off. I discovered that by using the Chrome User Experience Report, aka CrUX, site speed performance can finally be tracked over time. A good way to view results is with a Data Studio dashboard; when I’ve built this for my clients they always found it useful to understand whether their efforts in improving speed are paying off. With this post, I provide you with all the tools (and code!) to build your own. I’ll share with you the SQL code you can use to query data for your own site and build your reporting dashboard.
If you’ve never done a site speed audit, you may want to consider doing one, nonetheless for the fact that Google confirmed speed is a ranking factor. There are many free tools you can use for this, among which are:
- CrUX – also by Google, is what I use now most often and teach how to use on this post
- Lighthouse – by Google
- Webpagetest
The advantage of using CrUX is that it collects data from real users over time and regardless of their location, while Lighthouse and Webpage tests simulate the speed, analyzing it at a specific point in time and for a specific location. Using real user data provided on CrUX is the most in-depth way to analyze your site speed. In the steps below, you will learn how to:
- Access site speed data on CrUX
- Set up Google Sheets to use CrUX
- Query CrUX data (I’ll provide you with these)
- Create a CrUX report on Data Studio
Before we start, it’s important to choose the right metrics to measure your site’s performance. Depending on your site’s structure, some metrics may be more or less important than others. But if you’re not sure where to get started, this useful site speed metrics guide from Deepcrawl explains them really well.
For this article, I’m covering the following metrics, as they can contribute to slow down LCP, which is one of the metrics Google considers vital:
- Time to First Byte (TTFB)
- First Contentful Paint (FCP)
- DomContent Loaded (DCL)
- Largest Contentful Paint (LCP)
Step 1: Access site speed data on CrUX
Chrome User Experience data is public and accessible to anyone using Google BigQuery. To access the data you’ll have to log into Google Cloud and create a project to access the database, which is free to do. If you’ve never done it before, this video from Paul Calvano will walk you through the process in less than 5 minutes.
There is also this detailed guide by Google explaining how to access data through BigQuery. Once you are set up and ready to extract interesting information, you can get started. The goal here is to take you from an interface that looks like this:
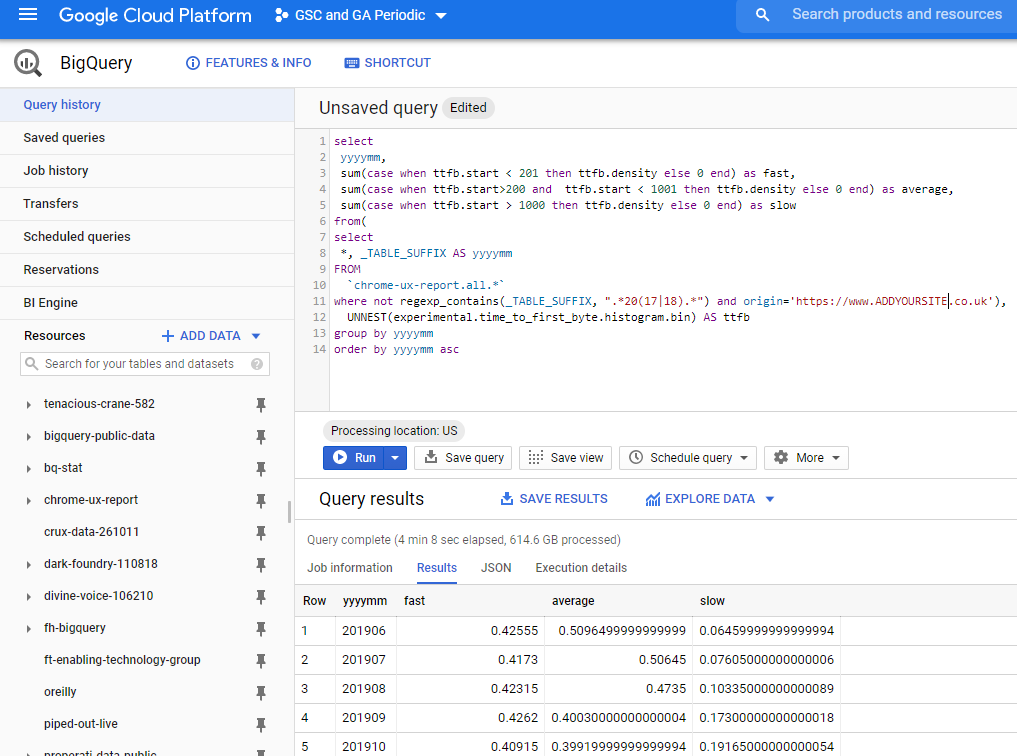
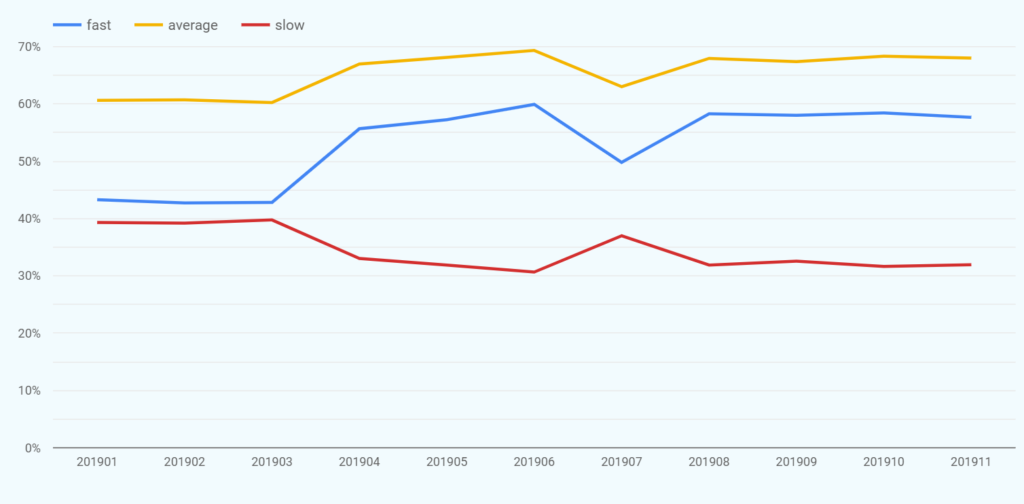
To a more user-friendly graph like this one, showing you how often your site has been fast, slow, and of average speed over time:
As I mentioned earlier, don’t worry if you’re not familiar with SQL. I’ll provide you with pre-written queries – all you have to do is customize them for the site and metric you’re interested in.
Step 2: Setup Google Sheet to Use CrUX
The best way to access the CrUX data and build reports is through BiqQuery, which requires connecting BigQuery to Data Studio. However, doing this can:
- Slow down the report when loading, as queries are accessing a big data set.
- Become costly: querying a data set is free up to a certain amount of data. As CrUX is a large data set, running queries on it too often, for example daily, will inevitably use up all the free allowance.
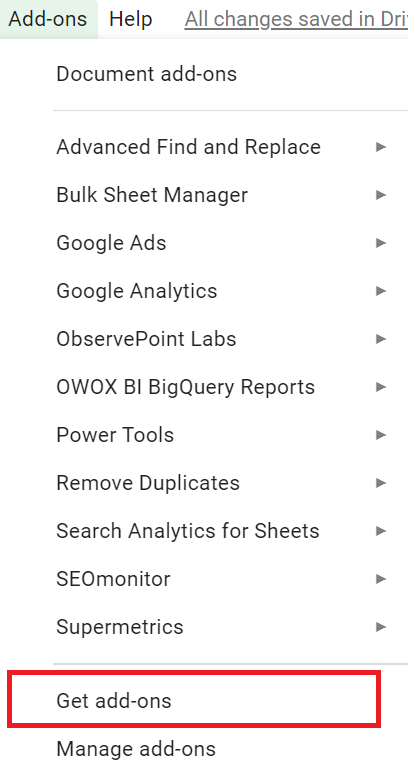
Since updating the data we are reporting is only needed once a month, I often use a free Google Sheets Add-on called OWOX BI BigQuery Reports. This add-on automates your queries to run on a required schedule. To add it to your Google sheets, go to the Add-ons menu, choose Get add-ons, and search for OWOX:

Once you’ve successfully added it to your Gsheets, you’ll see the following menu:

Next, we’ll use this add-on to create a new report and schedule it to run automatically.
Step 3: Query CrUX Data
For each metric listed below, I’ve included the SQL queries you need to get your own data. When copying them, remember to replace the website you’re measuring site speed for.
CrUX data is reporting on frequency of speed rather than just speed. This means that when we query the data, we are measuring how often the specific metric (for example, TTFB) was fast, average, or slow.
Please note that the speed ranges I used are those recommended by Google, however, you can modify them if you want to be less or more strict with the speed results you are measuring.
Time to First Byte (TTFB) Query
Since this is the very first response to a request, its speed is required to be one of the fastest, hence why the fast range is such a small range. Customize the query below for the time period you want – (this example includes data from January 2019) and obviously the site you are interested in:
select
 yyyymm,
 sum(case when ttfb.start < 201 then ttfb.density else 0 end) as fast,
 sum(case when ttfb.start >200 and ttfb.start < 1001 then ttfb.density else 0 end) as average,
 sum(case when ttfb.start > 1000 then ttfb.density else 0 end) as slow
from(
select
 *, _TABLE_SUFFIX AS yyyymm
FROM
  `chrome-ux-report.all.*`
where not regexp_contains(_TABLE_SUFFIX, ".*20(17|18).*") and origin='https://www.ADDYOURSITE.com'),
  UNNEST(experimental.time_to_first_byte.histogram.bin) AS ttfb
group by yyyymm
order by yyyymm asc
DomContent Load (DCL)
This is the query you will need for DCL. As before, adjust the website you want this data for:
select
 yyyymm,
 sum(case when dcl.start < 1501 then dcl.density else 0 end) as fast,
 sum(case when dcl.start>1500 and dcl.start < 2001 then dcl.density else 0 end) as average,
 sum(case when dcl.start > 2000 then dcl.density else 0 end) as slow
from(
select
 *, _TABLE_SUFFIX AS yyyymm
FROM
  `chrome-ux-report.all.*`
where not regexp_contains(_TABLE_SUFFIX, ".*20(17|18).*") and origin='https://www.ADDYOURSITE.com'),
  UNNEST(dom_content_loaded.histogram.bin) AS dcl
group by yyyymm
order by yyyymm asc
First Contentful Paint (FCP)
select
 yyyymm,
 sum(case when fcp.start < 1001 then dcl.density else 0 end) as fast,
 sum(case when fcp.start > 1000 and fcp.start < 1501 then dcl.density else 0 end) as average,
 sum(case when fcp.start > 1500 then dcl.density else 0 end) as slow
from(
select
 *, _TABLE_SUFFIX AS yyyymm
FROM
  `chrome-ux-report.all.*`
where not regexp_contains(_TABLE_SUFFIX, ".*20(17|18).*") and origin='https://www.ADDYOURSITE.com'),
  UNNEST(first_contentful_paint.histogram.bin) AS fcp
group by yyyymm
order by yyyymm asc
Largest Contentful Paint (LCP)
select
 yyyymm,
 sum(case when lcp.start < 2501 then dcl.density else 0 end) as fast,
 sum(case when lcp.start > 2500 and lcp.start < 4001 then dcl.density else 0 end) as average,
 sum(case when lcp.start > 4001 then dcl.density else 0 end) as slow
from(
select
 *, _TABLE_SUFFIX AS yyyymm
FROM
  `chrome-ux-report.all.*`
where not regexp_contains(_TABLE_SUFFIX, ".*20(17|18).*") and origin='https://www.ADDYOURSITE.com'),
  UNNEST(largest_contentful_paint.histogram.bin) AS lcp
group by yyyymm
order by yyyymm asc
Add queries on Google Sheets
By clicking on “Add a new report” under the OWOX BI BigQuery Reports menu, you can create the report you need and add the query to the sheet.
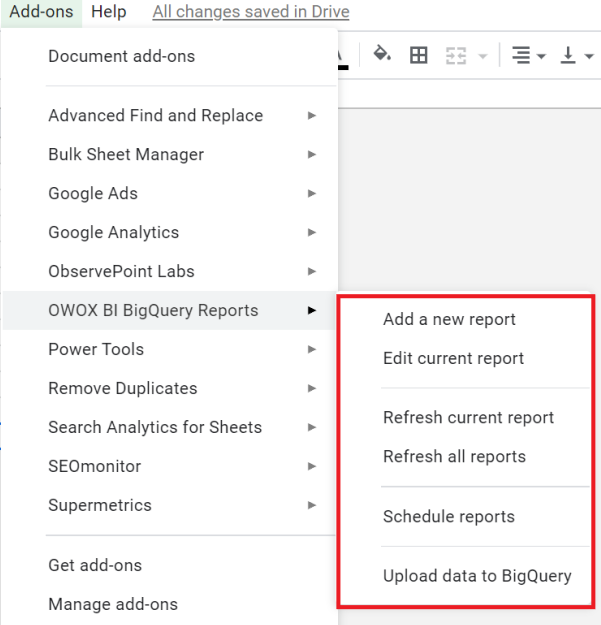
A sidebar menu will appear with two options, which you can set as the following:
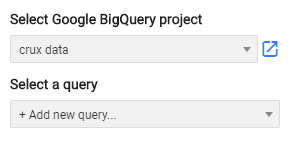
After selecting these options, a pop-up box will appear with a SQL query already written. Replace it with one of the queries from above, for example below is TTFB. Again, replace the website with the one you are trying to measure:
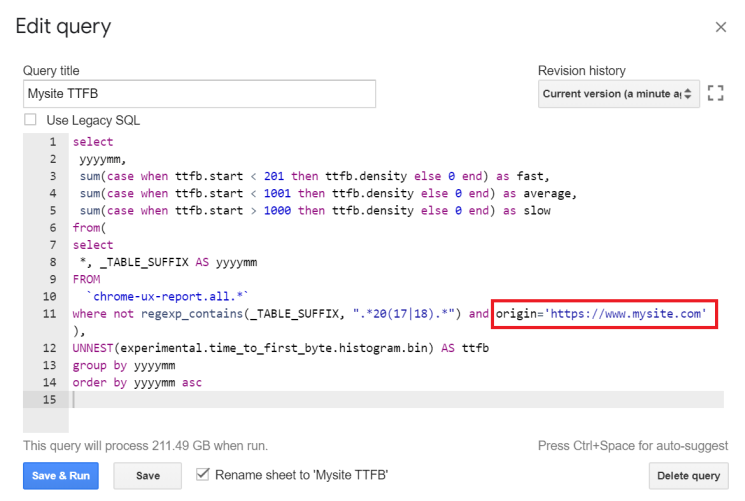
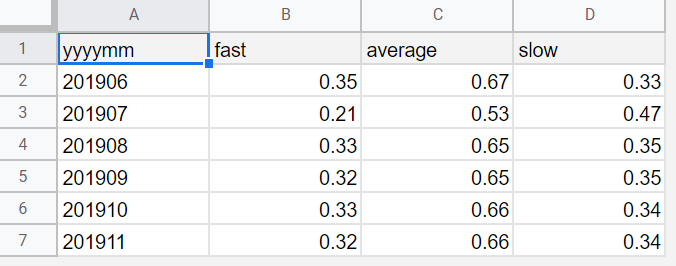
Once you hit Save & Run, the query will return a table on Google sheets similar to this one:
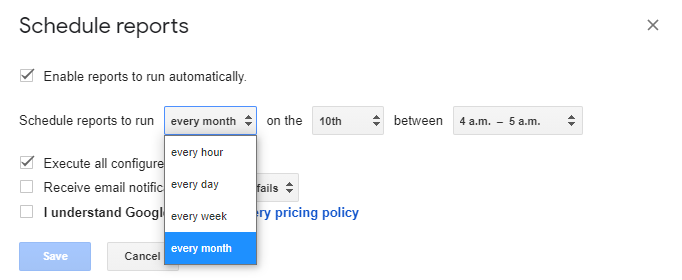
You can schedule these to execute automatically by selecting Schedule reports:
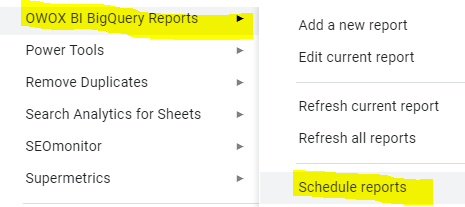
This will prompt you to choose your schedule for running the query. I usually schedule it monthly, as that’s how often Google updates the CrUX:
Repeat this process for each of the metrics you want to measure. I would recommend creating a new Google Sheet each time, as it will be easier to manage and run them.
Then you’re ready for the next step: connecting the Google Sheet containing this data to Data Studio.
Step 4: Create a CrUX report on Data Studio
If you’ve never used Google Data Studio before, this guide will help you get started. If you already have that setup, create a new dashboard and add Google Sheets as the data source:
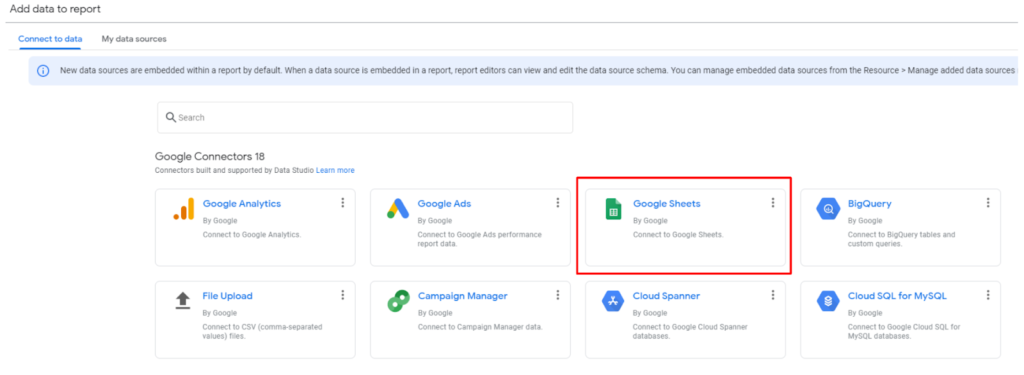
On the next screen, choose the name of the Gsheet file where your data is. If it’s not listed as one of your resources, simply paste the URL, then choose the tab that includes your data:

Now add the following line chart:
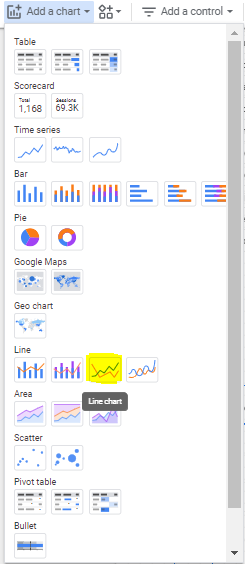
On the line chart set up, add dimensions and metrics as follows, sorting the data by date:

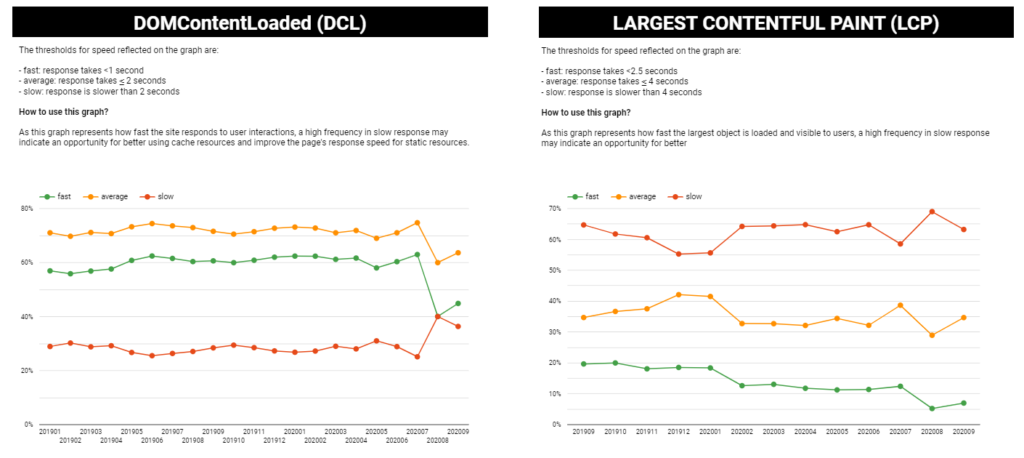
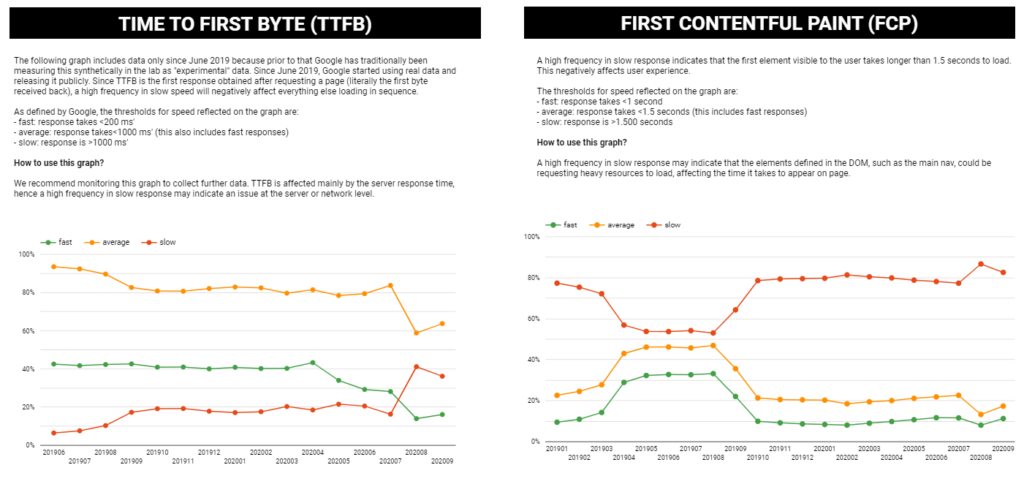
The result will be a graph that looks like this. The percentages on the Y-axis represent the frequency with which the metric we are measuring has been fast, average, or slow:
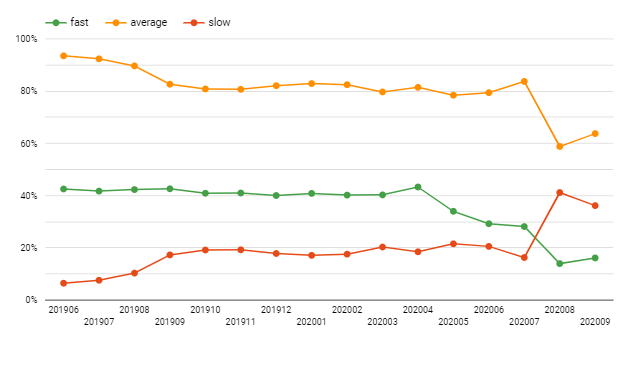
Repeat this process for each metric you are reporting on to get a fully automated report that quickly visualizes your speed performance over time:
While the technical reasons why a site might be fast or not require a separate analysis, creating a site speed dashboard is the first step in finding out whether you have a problem or not. I hope you found this guide to building your dashboard useful.

