SEO Forecasting
Statistical forecasting is a powerful tool that’s been used at Distilled for a while, both by consultants when analysing client data and by our in-house monitoring tool that alerts us to problems with client sites. In this post, I’m publicly launching a free forecasting tool that I spoke about last week at BrightonSEO, and explaining how to make best use of it.
Using the tool
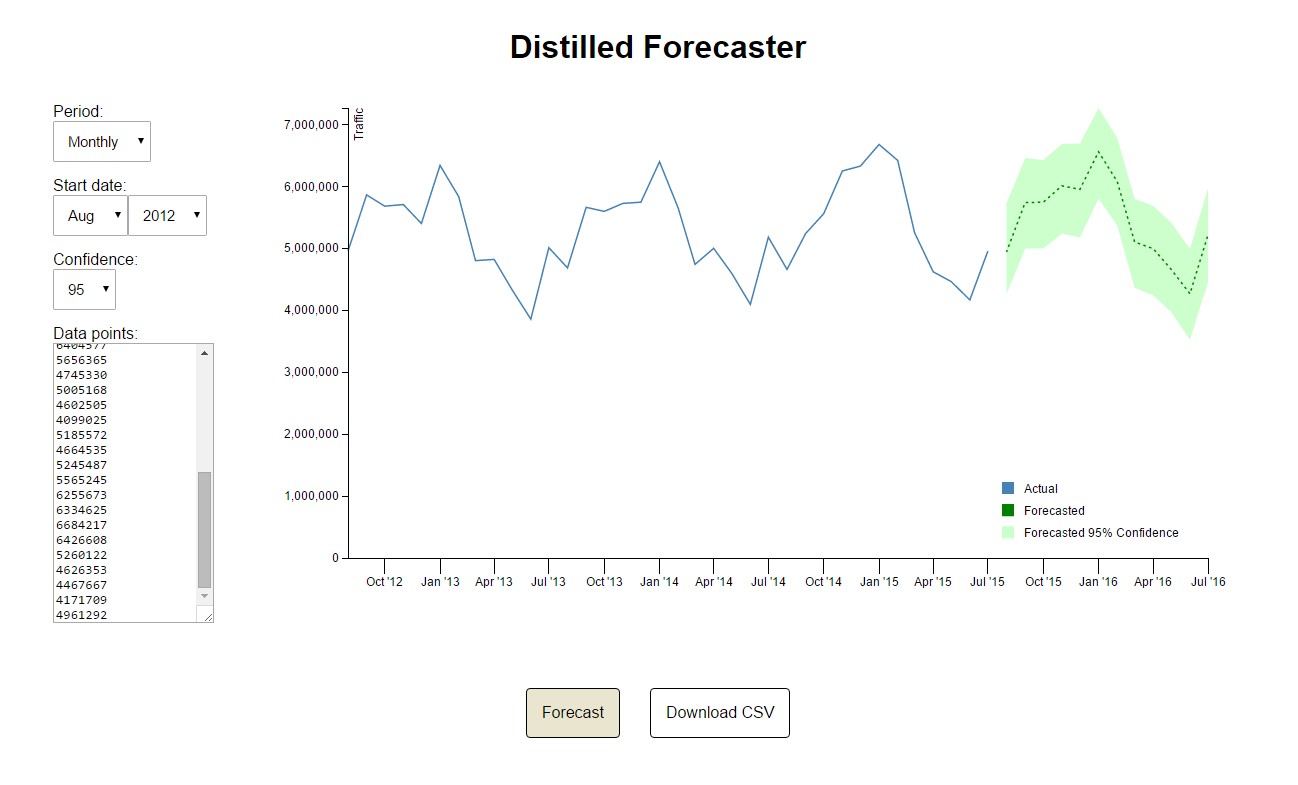
You can access the tool at distilled.net/forecaster. It utilises the CausalImpact R package which you can read about in this paper published by Google if you’re so inclined, but don’t worry if you’re not – the precise purpose of the tool is to make these methods accessible.
The fields on the left allow you to create and configure your forecast:
-
Period allows you to choose whether to enter monthly or daily data. The tool is configured to look for annual seasonality in monthly data (e.g. Black Friday, school summer holidays) and weekly seasonality in daily data (e.g. quiet Sundays).
-
Start Date is the date of the first datapoint of the historical data that you enter.
-
Confidence Interval controls the green confidence interval area displayed on the graph and in the CSV export – more on this below.
-
Data Points is where you should copy the data from your analytics platform. I recommend you use at least 24 months of monthly data or at least 14 days of daily data (more on this below, too).
Confidence intervals
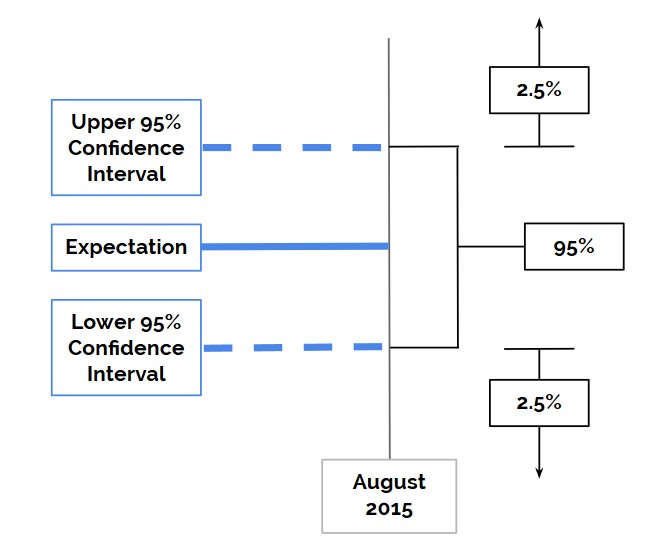
The diagram above shows confidence intervals for a single data point in a forecast. For any one data point, the expectation is our forecast – it is where, if we had to guess, we’d say that traffic levels would fall for this point in time. The space between the two blue dotted lines is the range within which, if our model holds, we think that there is a 95% chance traffic levels will fall (in the case of 95% confidence intervals). And lastly, the space outside of this range is where the remainder of the possibilities lie – 2.5% on each side here.
You may be familiar with this rough concept from A/B testing – when we say that something is 95% significant, this is equivalent to saying that it fell outside of the 95% confidence intervals – in other words, if nothing actually changed (i.e. it is an A/A test), there is only a 5% chance of us getting a value this far from our expectation.
Things to avoid
Large one-off spikes
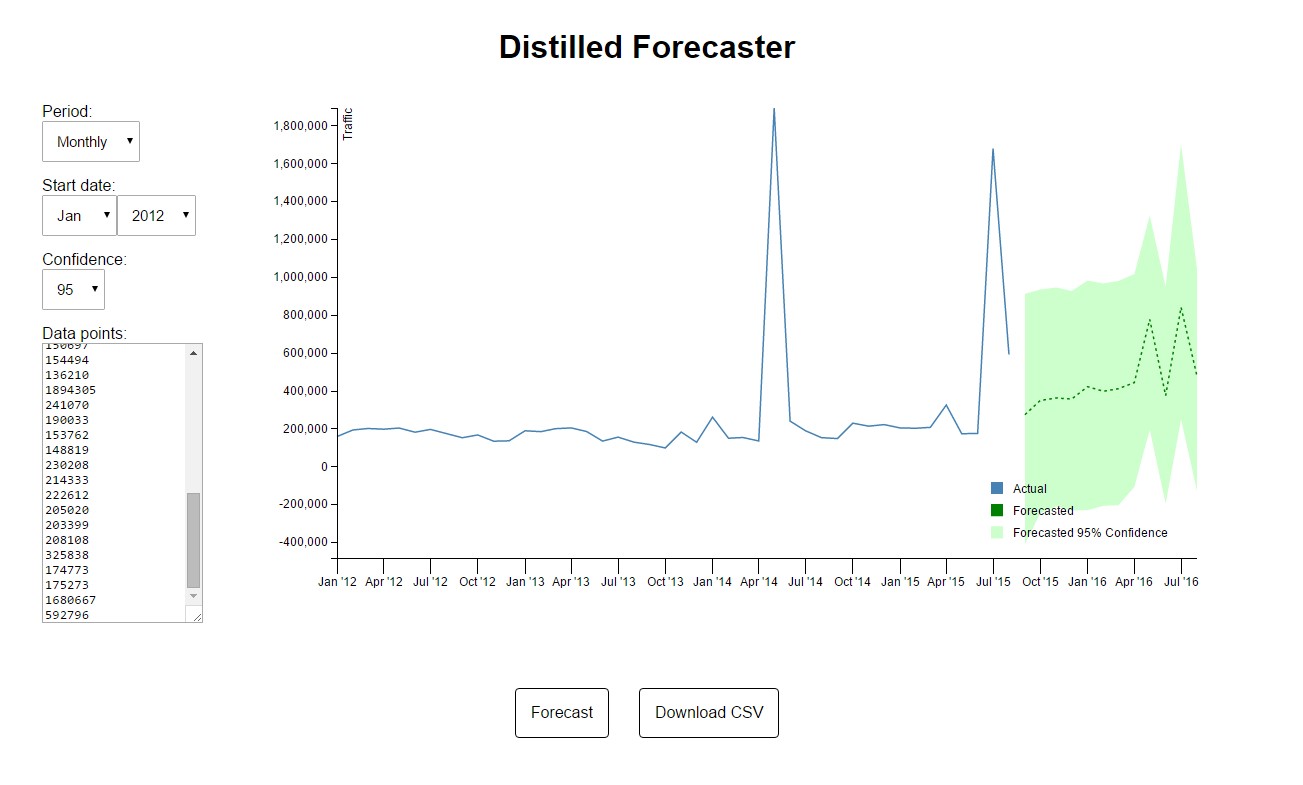
The picture above shows historical data with two massive traffic spikes caused by creative pieces. Because our model is doesn’t flag this up, it hasn’t really been able to make head-nor tail of these and the resulting confidence intervals are huge.
There are two options when your data contains anomalies like these:
-
Create a model that allows you to flag them up. This is something we’re considering adding to the tool, but for now you’d need to go back to the regression tools in Excel.
-
Use our tool, but use a segment of your data that excludes the spikes. For example, in this case I could use a segment that only included the core, revenue-driving landing pages.
Not using enough data
I mentioned above that I recommended using at least 2 years of monthly data or 2 weeks of daily data, and that’s for good reason.
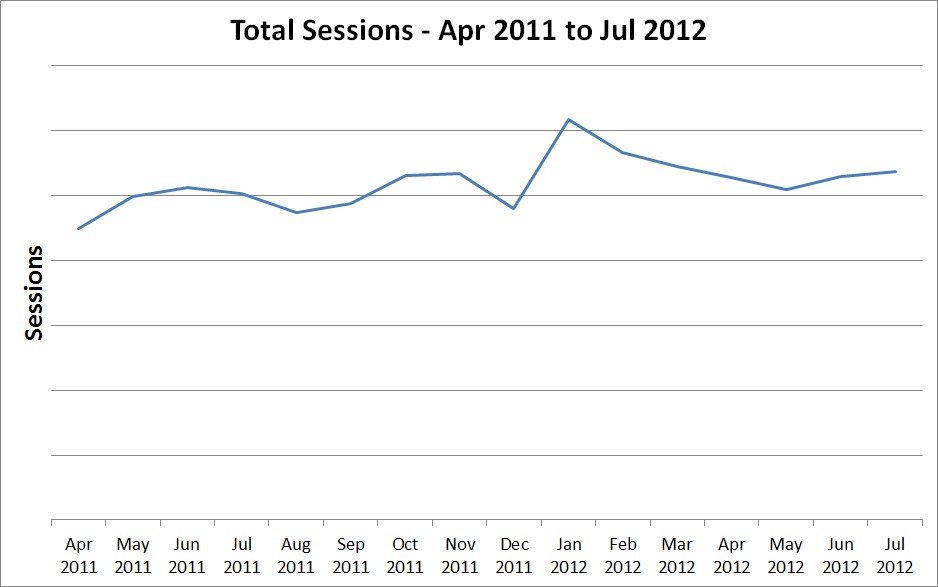
The above graph shows 16 months of data, but only one January – which is the spike in the middle. The problem here is that this spike could represent either a one-off anomaly or an annual January spike (e.g. January sales), and there’s no way of telling without more context.
Worse yet, you might have less than 12 months of data:
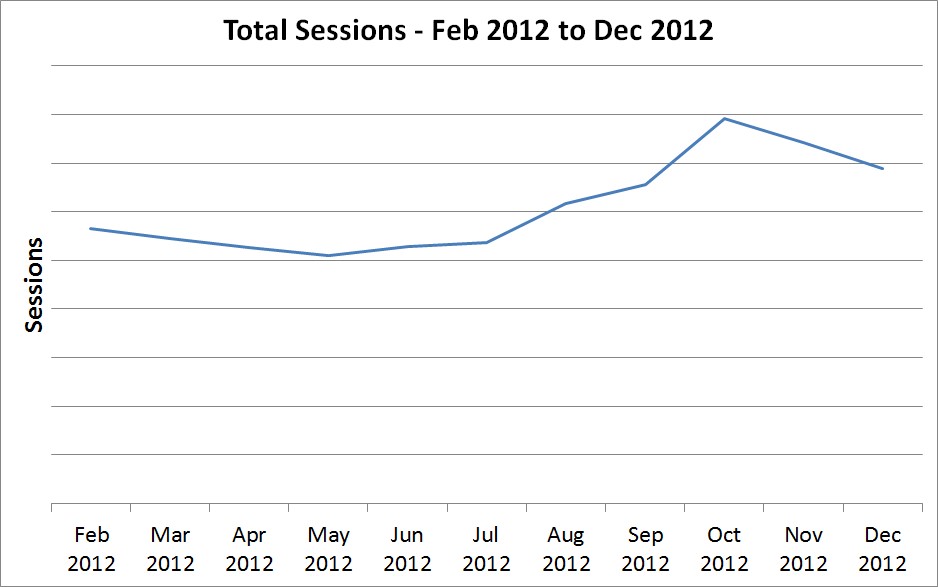
Now we can’t identify whether that spike in October was an annual spike or a one-off anomaly, and we also have no information at all on the missing months – there’s no January here at all. If your site has a spike for January sales, any forecast based on this data will not account for it in any way.
Use cases
Forecasting and targets
The most obvious use of a tool like this is predicting future traffic levels. Because any forecasts built on historical data assume that all the information contained in that historical data is representative of the future, the forecast is a forecast for what will happen if everything continues just as it has done – so if Google penalises you every 6 months, this assumes that they will continue to do so. Similarly, if you have been running a continuous marketing campaign, this assumes that you will continue to do so.
As such, unless something is likely to suddenly change, this means that your forecast ought to also be your target. It is unrealistic to set a target that assumes miraculous change out of nowhere. This means that sometimes you will find yourself setting negative targets, and there’s where this kind of methodology really comes in for securing buy-in – because you can go to your boss, or client, or stakeholders, and say “This is what happens if nothing changes, here’s what I propose we change”.
Detecting change
Sometimes the question is not “What happens if nothing changes?” but “Did something change?”. In these cases, the methodology is slightly different. Rather than taking all the data up to the present day as the input for our forecast, we should take all the data up to the date of the suspected change that we wish to investigate.
For example, say a client wants to investigate the effects of a November migration, which they suspect were negative. We would take data leading up to (but not including) November, and then forecast from that point. This means that we are creating a forecast of what happens from November onwards if everything had continued as before – this is called a counterfactual, and is pictured below.
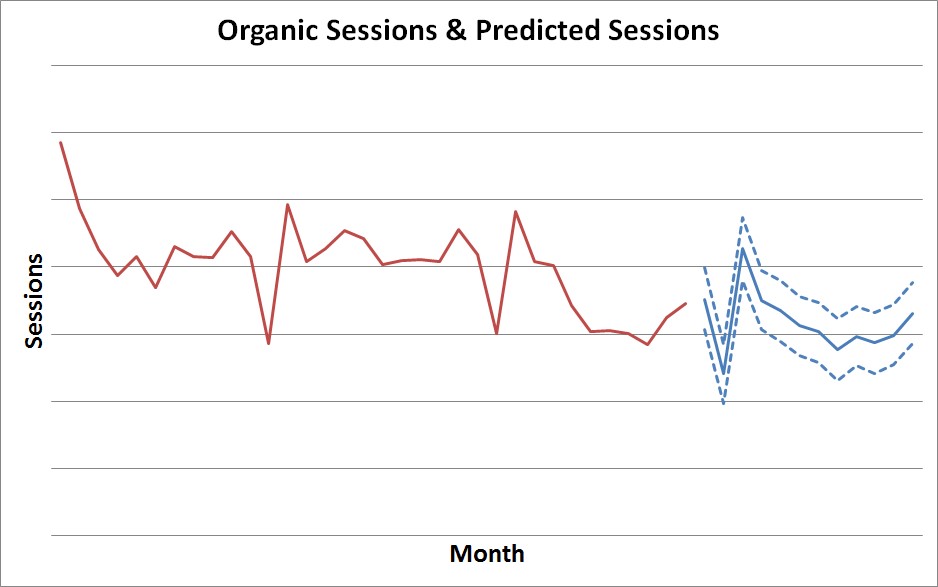
The blue dotted lines here are 95% confidence intervals. If actual traffic levels stayed within the range predicted based on pre-migration traffic, we are inclined to think that the migration had no significant effect. If actual traffic levels stray beyond these boundaries, on the other hand, then the points at which they do so represent a statistically significant effect of the migration.
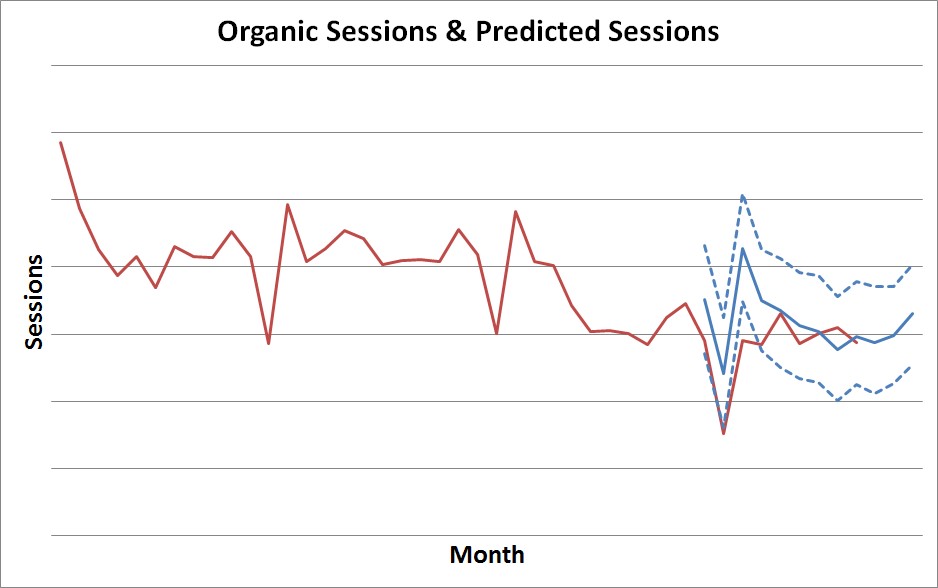
Above I’ve added in the actual traffic levels on the same graph, and it looks like any effect of the migration was relatively short-lived.
Calculating ROI
The case for calculating ROI is rather analogous to how we’d go about detecting change, apart from two main factors:
-
We’re probably interested in revenue rather than sessions (though there’s no reason you couldn’t look to detect change in revenue)
-
We’re now less interested in whether a change was significant than how far it was from the expectation – this number represents our best guess for how much additional revenue was generated during that month or day.
Note ‘best guess’, which brings me neatly onto:
Caveats
These methods are all about the what, and not at all about the why or the how.
For example, say you were using a counterfactual to measure the effect of an on-page SEO change. If something else happened at the exact same time (perhaps a mention on an obscure television show), then you can’t separate the effect of these two events without a more complex model. And even if you do build a more complex model, you still might have missed something.
This approach is well worth using and a huge improvement over the eyeballing and vague platitudes traditionally employed in our industry, but you do still need to know what’s going on.


