Omniture Beginner’s Tutorial
Back in December 2013, I wrote a tutorial post showing how to find basic analytics data in Omniture, and explaining differences in terminology between Omniture and Google Analytics. Both platforms have seen some changes since then, so this refresh restores the guide to its original usefulness.
Before we get stuck in, keep in mind that one of the main important differences between Google Analytics and Omniture is that Omniture setups are always custom. As such, installations can vary in what they show by default and how reports are grouped.
Navigation Basics
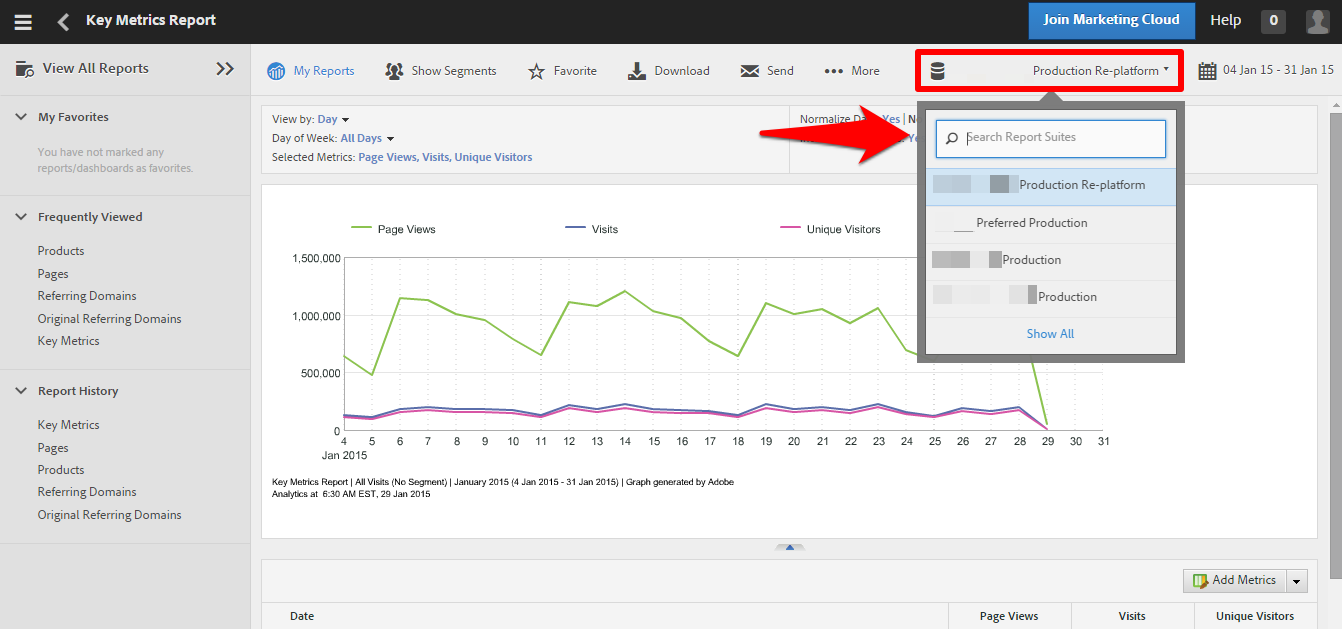
Firstly, make sure you’re looking at the correct report suite – report suites are Omniture’s equivalent of Google Analytics’ views:
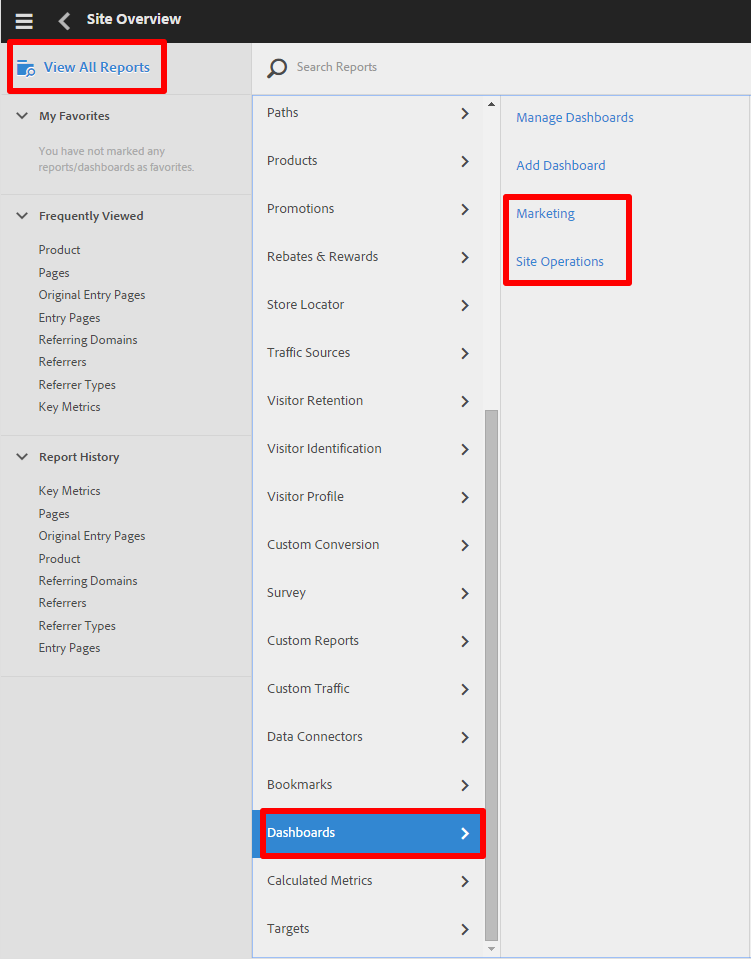
Secondly, it’s possible that your client already has what you’re looking for set up as a dashboard. If they’re not in the favourites menu, Omniture dashboards can be fairly easy to miss, and if nothing else might give you an insight into what your client is already monitoring:
Metrics
Before we get into reports, it’s worth understanding the metrics menus in Omniture – especially as Omniture often doesn’t show you the most useful metrics by default.
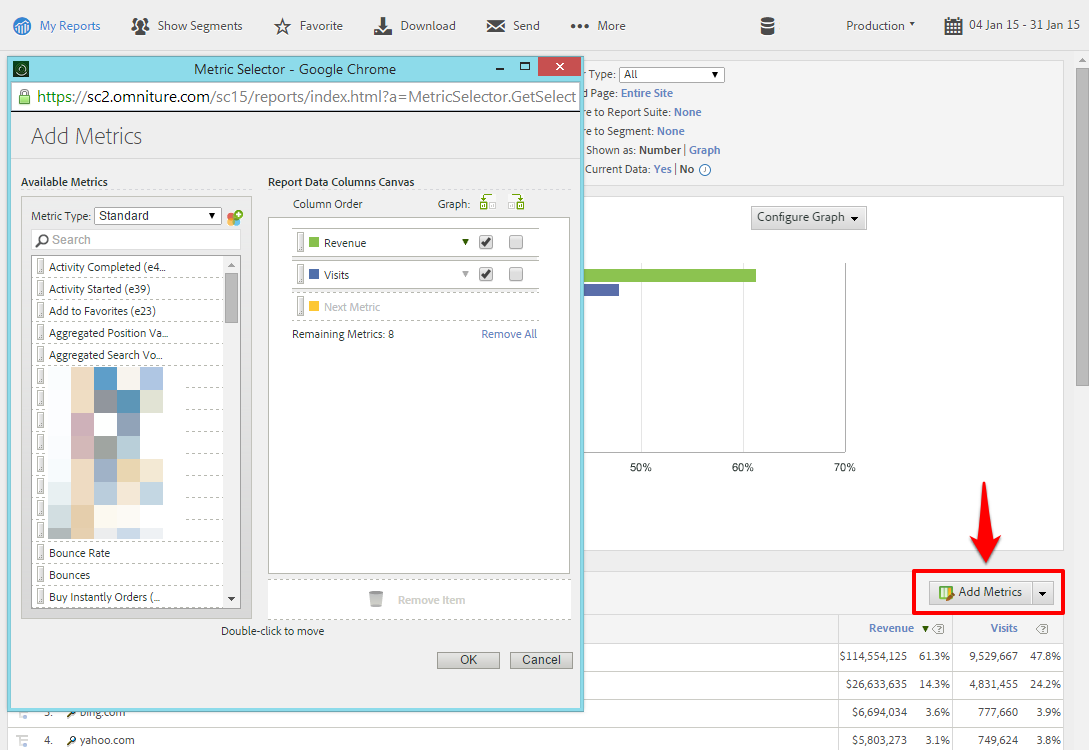
The report suite shown above, for example, is only showing two metrics for the referring domains report by default – revenue and visits. We can bring up the metric selector using the “Add Metrics” button on the right hand side, and drag and drop metrics into the “canvas” in the pop-up window.
Notice at the top of the list of metrics there’s a dropdown box to select between “standard” and “calculated” metrics. Unfortunately you’re going to have to use the calculated metrics box sooner or later – I’ve seen Omniture setups that didn’t have conversion rate as a standard metric, so let’s run through that as an example:
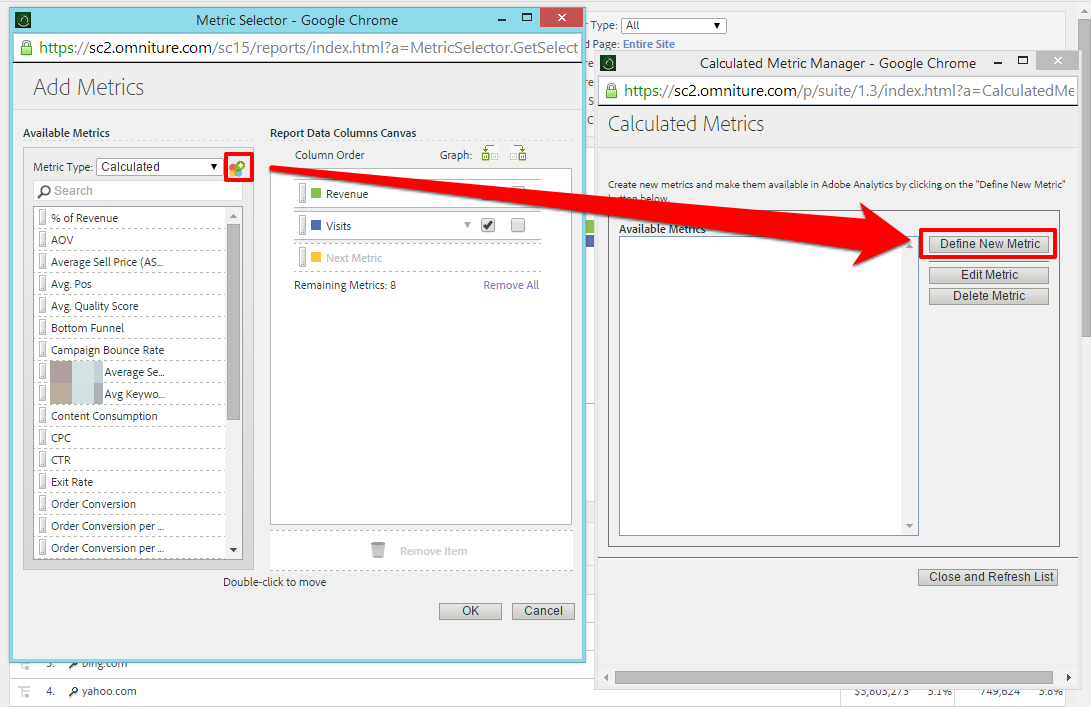
If we select “Calculated” in the drop down box, we can click the colourful symbol next to it to manage our calculated metrics. To add components to the formula, they have to be selected in the menus, and then you can click “Add to Formula”.
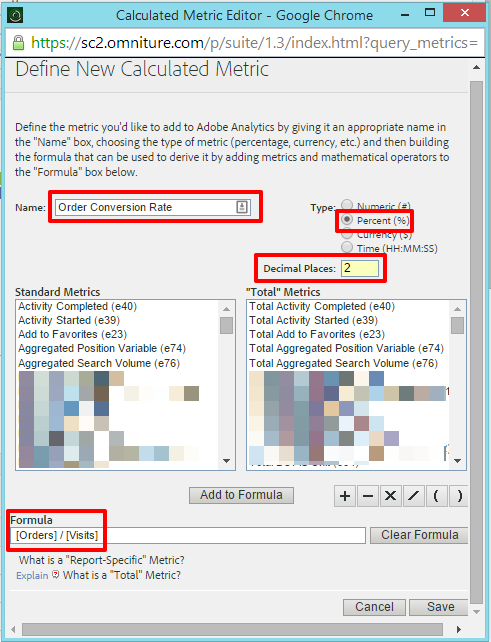
For my order conversion rate I have selected
- Name: Order Conversion Rate
- Type: Percent (%)
- Decimal Places: 2
- Formula: [Orders]/[Visits]
Once we’re done we can click “save”, followed by “close and refresh list”, and our new calculated metric will be available to drag and drop into reports like a standard metric.
Segments
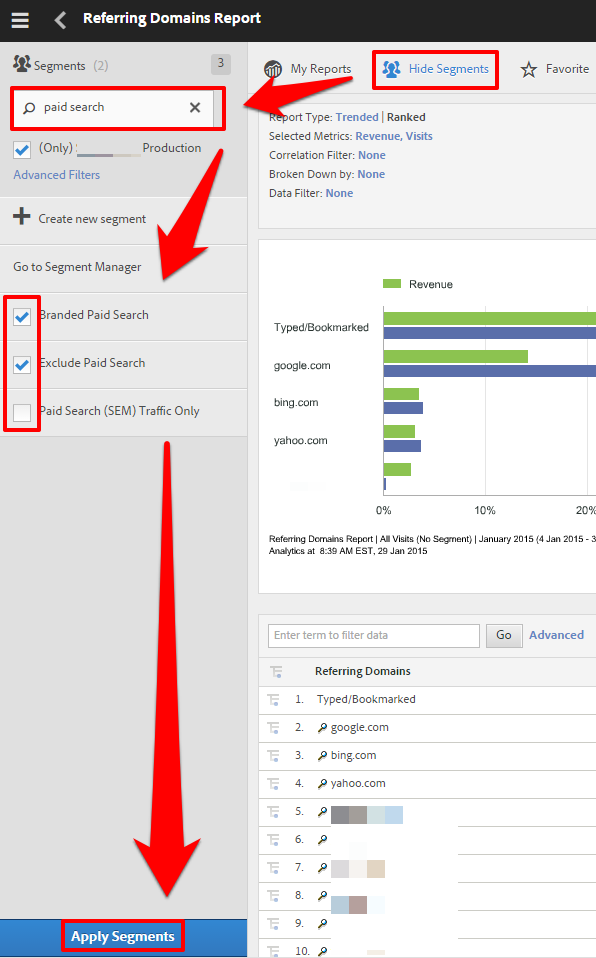
Segments in Omniture work much like they do in Google Analytics, and Omniture has now gained the ability to apply multiple segments. To access the segments menu, click “Show Segments” at the top of any report, then search and select segments from the list in the left sidebar:
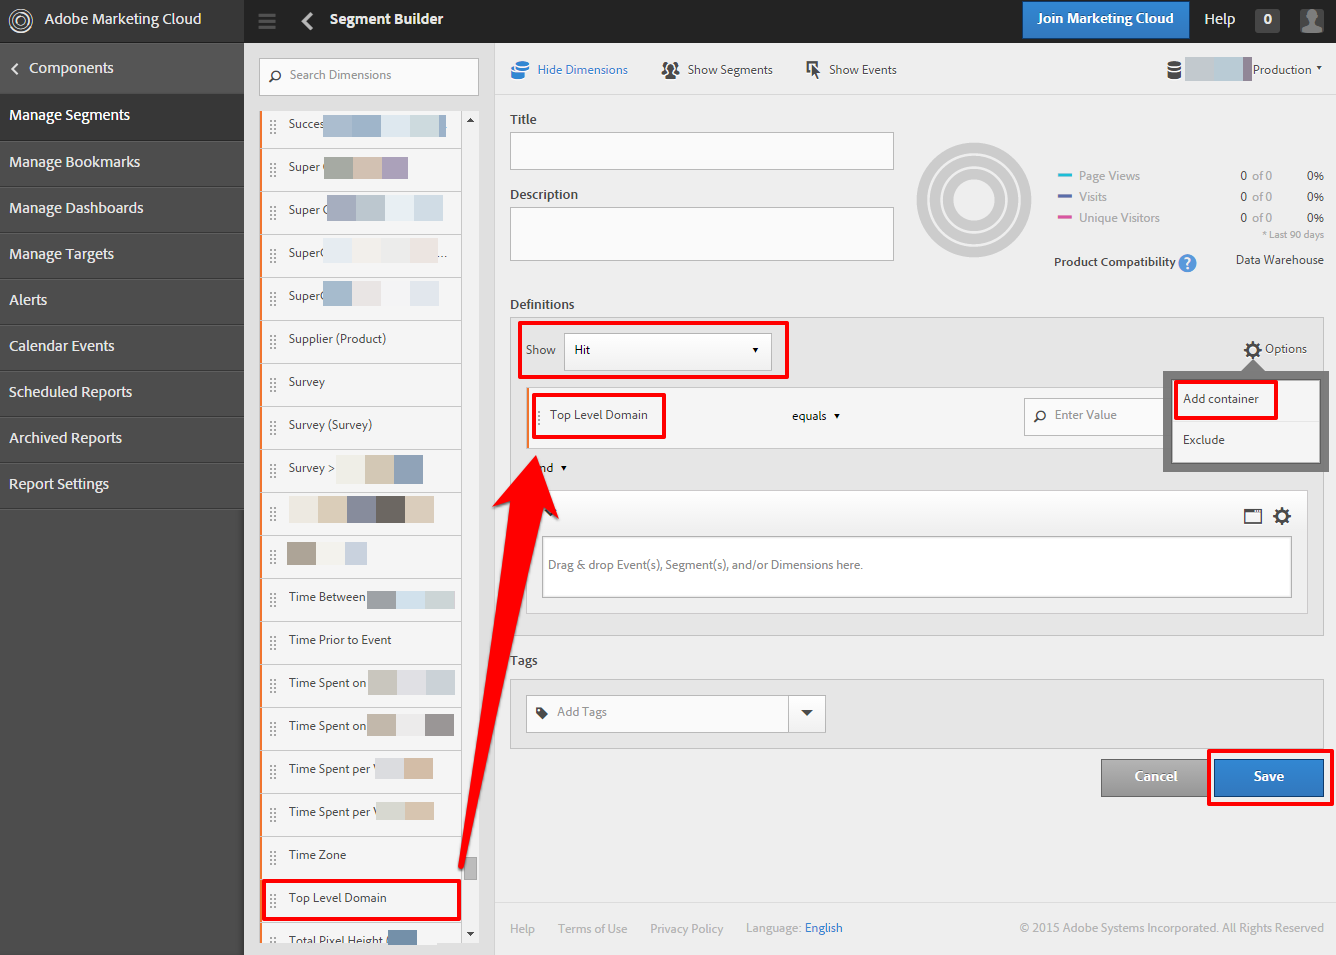
To add a custom segment, select “Create new segment” from this menu. In the following menu, you can drag “dimensions” from the left into “containers” on the right, and define the scope of the segment as hit, visit or visitor (equivalent to hit, session and user in Google Analytics):
Acquisition
If you’re used to Google Analytics, then you’re used to an acquisition overview looking something like this:
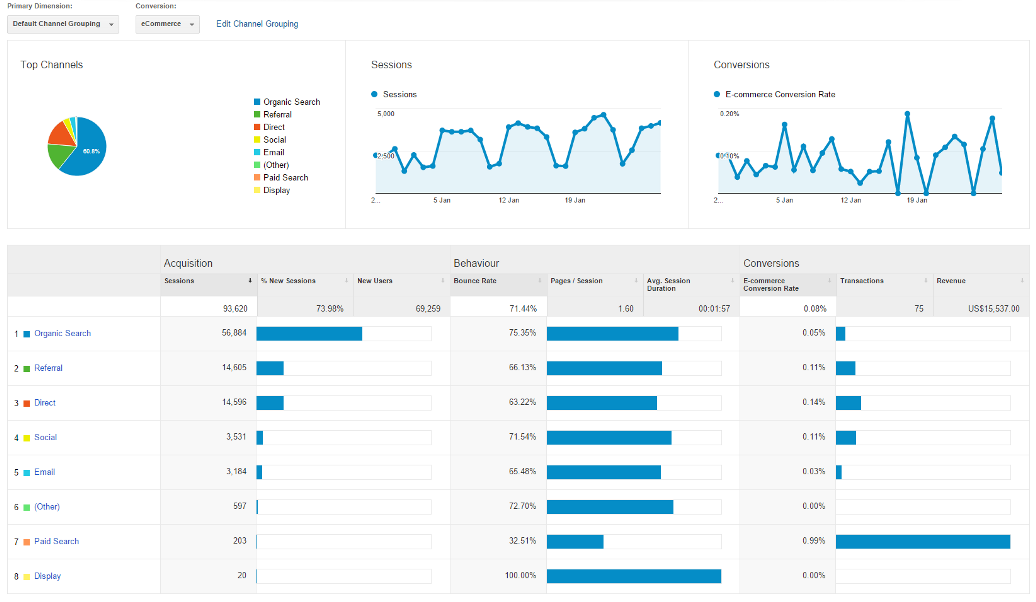
Unfortunately, this is fairly hard to replicate in a default Omniture setup. The closest thing you can get is the Referrer Types report:
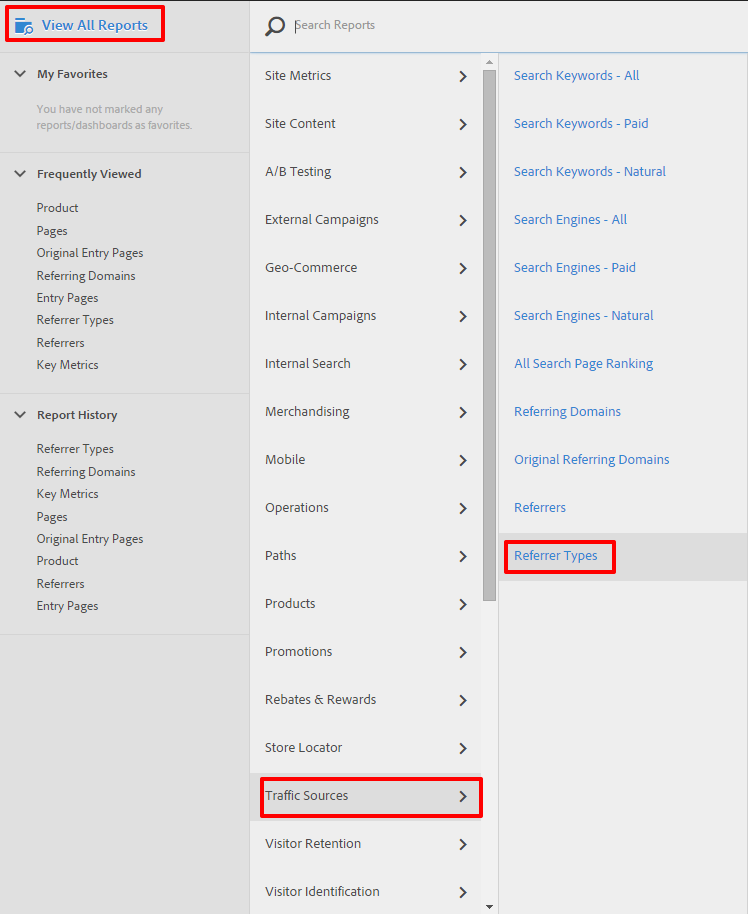
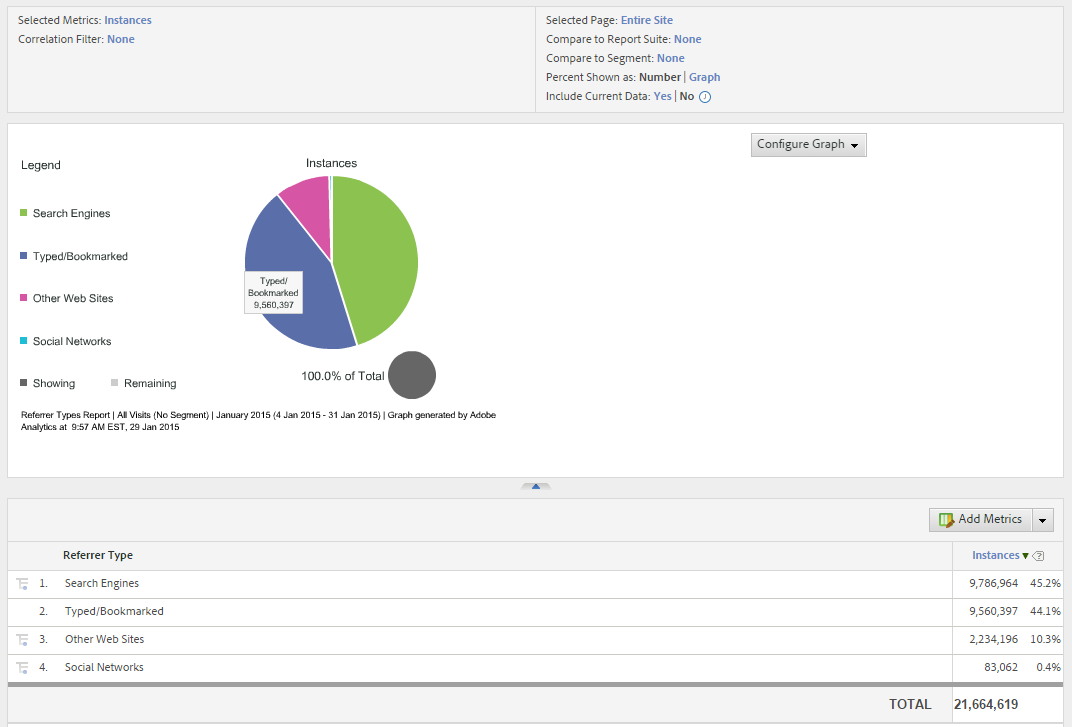
The main problem here is the lack of separation between PPC and organic traffic. You’ll have to use the “Search Engines – Paid” and “Search Engines – Natural” reports in the same menu to figure that out.
One interesting report that’s not as easy to replicate in Google Analytics, however, is “Original Referring Domains” – as you might expect, this shows the source that visitors had on their very first visit to the site. Unlike Google Analytics, Omniture does not exclude search engines from the list of referring domains. This makes this report pretty useful if you’re interested in what visitors are discovering your site through, as opposed to what they use to find it once they know what they’re looking for.
Audience
In Google Analytics, an audience overview looks something like this:
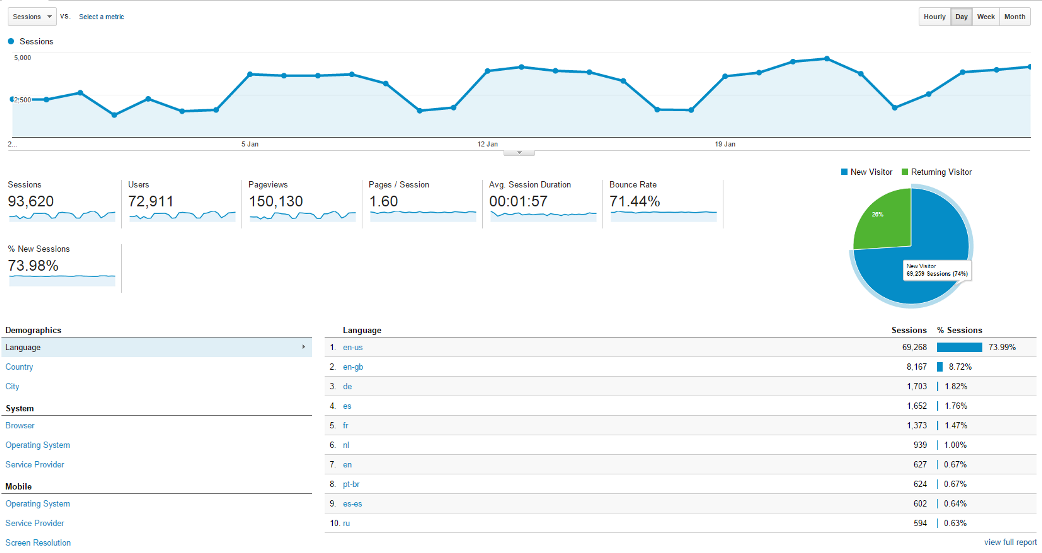
Again, this isn’t replicated as a one page report in a default Omniture setup, but Omniture does have some pretty interesting stuff under “Visitor Profile”:
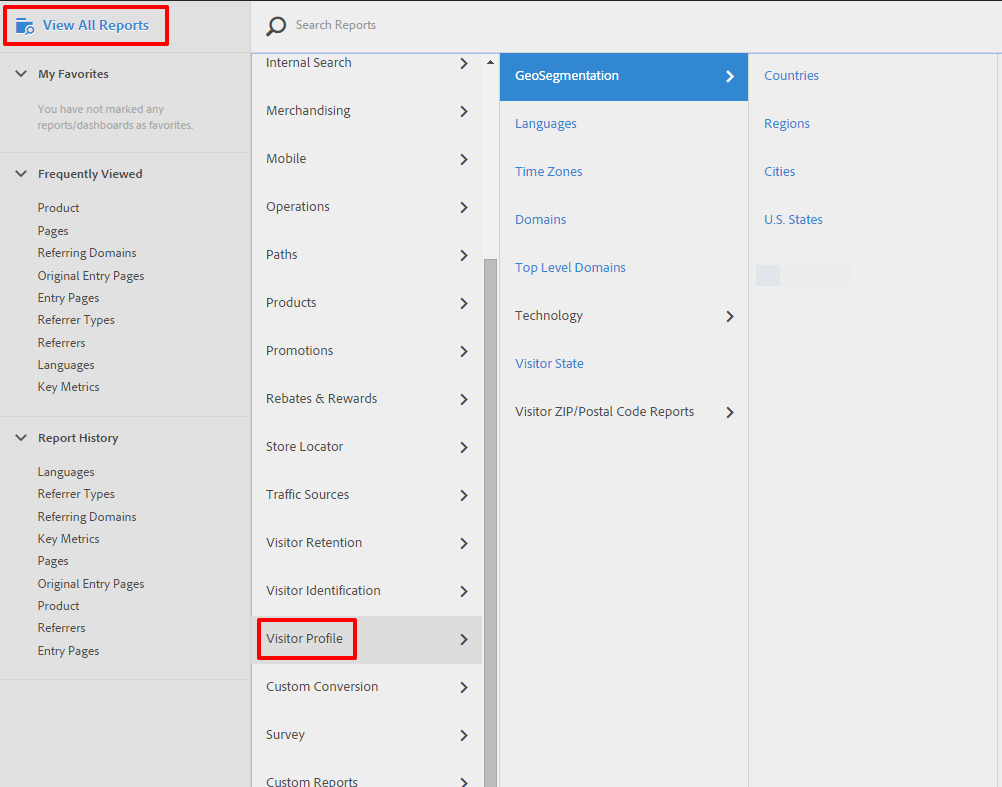
This gives you all the options you need to check for browser-specific bugs, geographic data, traffic anomalies and more. Some of the stuff you’re used to seeing under “Audience” in Google Analytics is listed under “Visitor Retention” in Omniture, and the closest equivalent to Google Analytics’ awesome “User Flow” visualisation is the “Paths” menu – more on that shortly…
Behaviour and Flow
For me, the most useful applications of Google Analytics’ behaviour reports have been the ability to explore the performance of landing pages and the behaviour of visitors that land on them. Both are replicated in a default Omniture setup, and there are a few other neat tools available to complement them.
Landing Pages
A landing page report can be found under “Paths” -> “Pages” -> “Entries & Exits” -> “Entry Pages”:
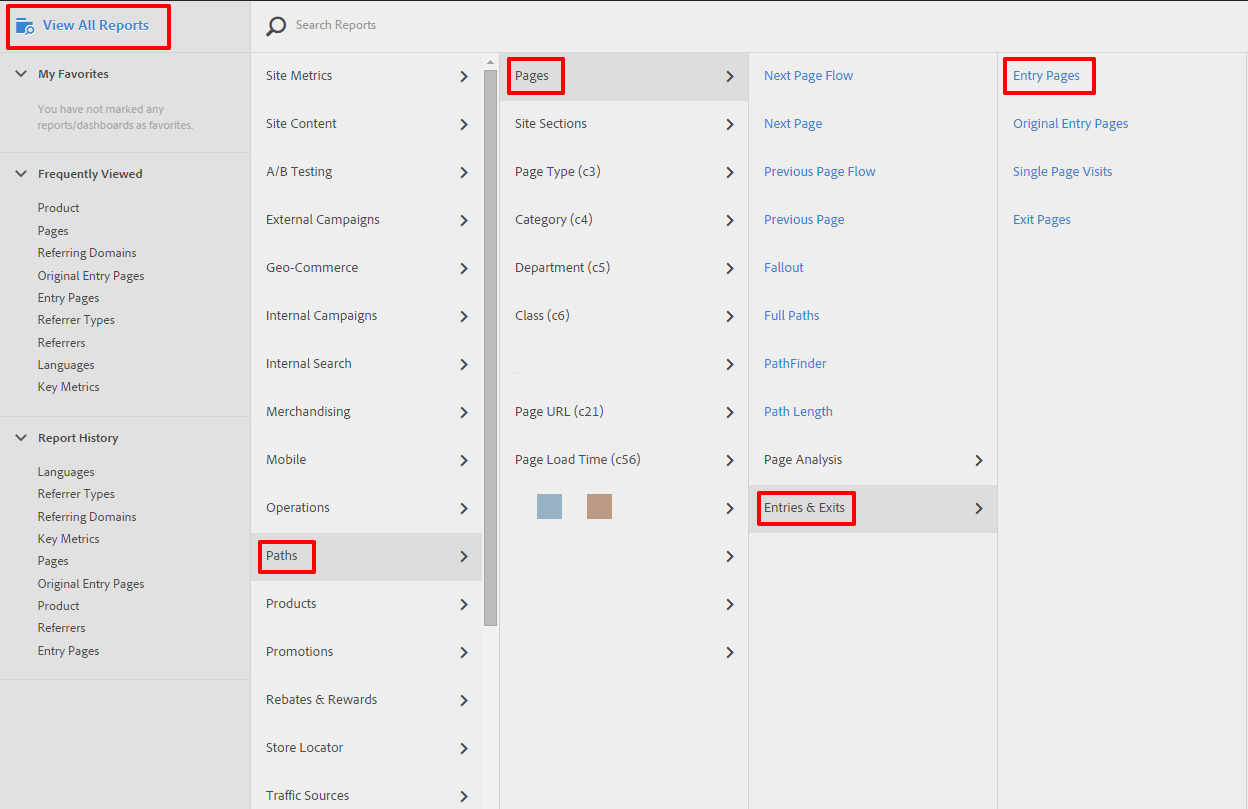
Note also “Original Entry Pages”, a really handy report that’s fairly complex to replicate in Google Analytics.
Flows & Paths
The paths menu is loaded with awesome tools. Firstly you get the regular entry (landing) page and exit page reports you’re used to seeing in Google Analytics, but then there’s also the page flow reports, which allow you to select a page and view either how people get there or where they go from there.
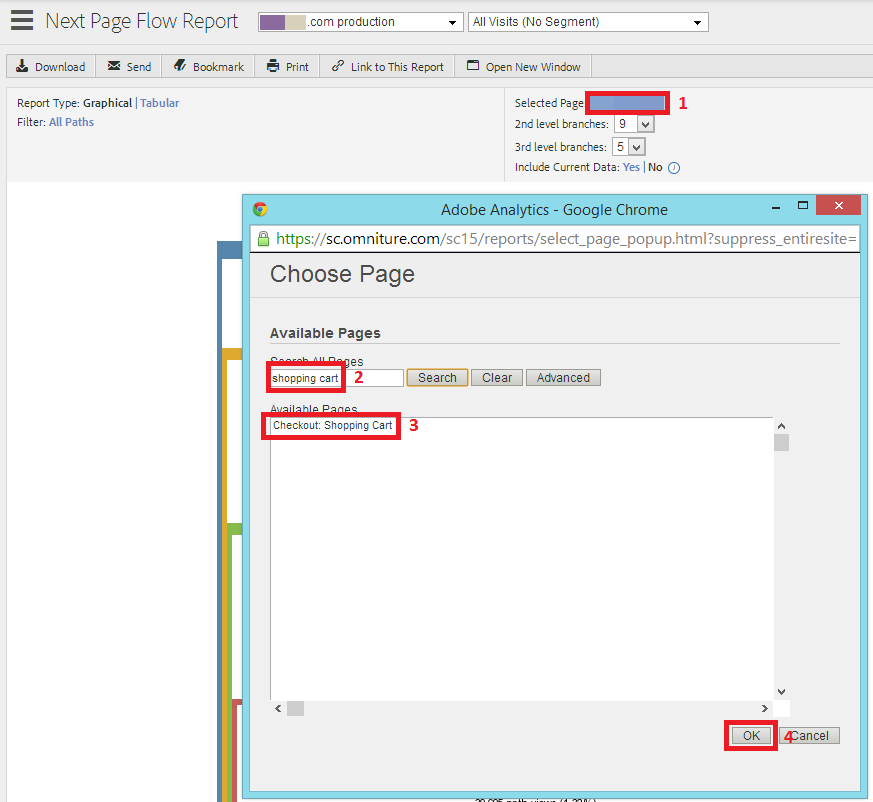
The paths reports are well worth exploring in full, but another especially useful tool is the PathFinder Report. The “Sandwich Pattern”, for example, could be used to analyse the most common routes taken from a landing page to a checkout page.
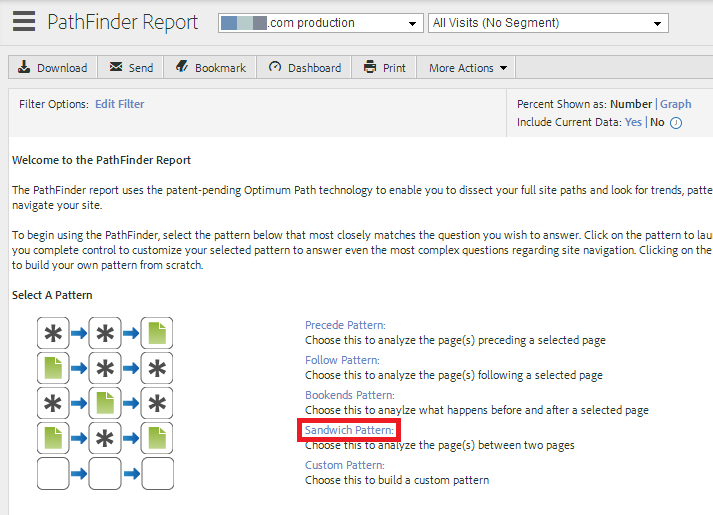
The paths reports are also Omniture’s best answer to Google Analytics’ flow visualisations. They’re certainly not as pretty, and they’re not as useful for analysing longer user journeys through a site, but they can still provide the same kinds of insights.
Site Speed
Site Speed reporting can be found under “Site Metrics” -> “Performance”:
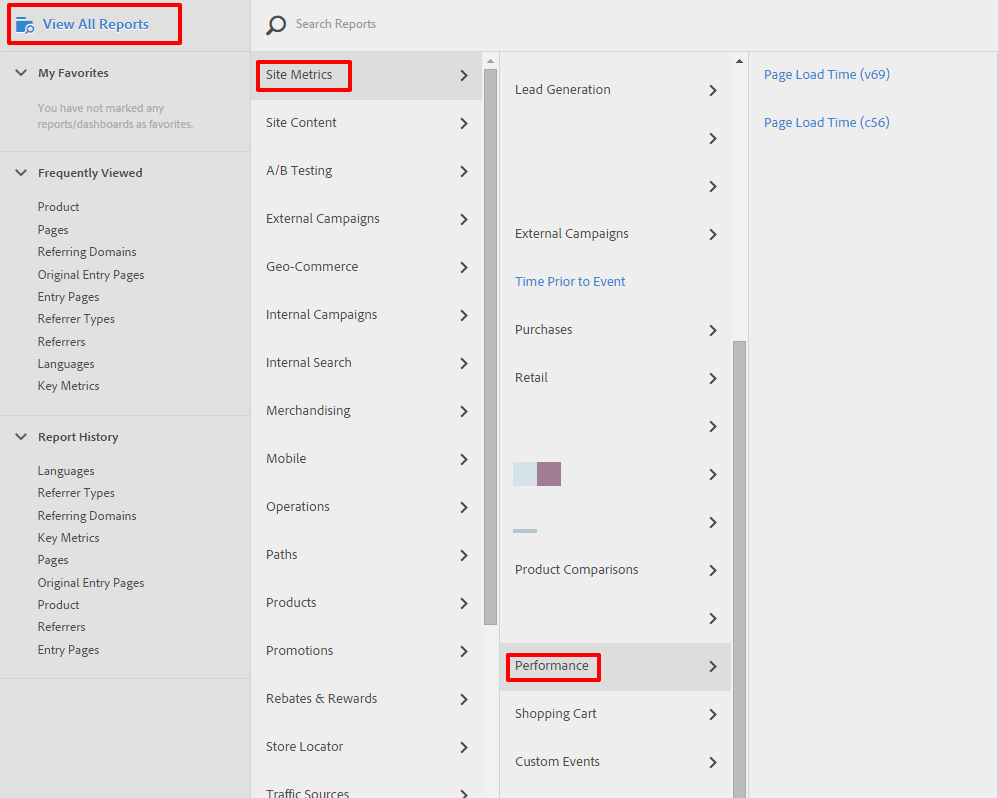
Unfortunately, this report does not seem to be available in the majority of Omniture implementations I’ve seen.
Conversions
Presuming they’ve been set up, you can get the basics on conversion data in Omniture with two reports:
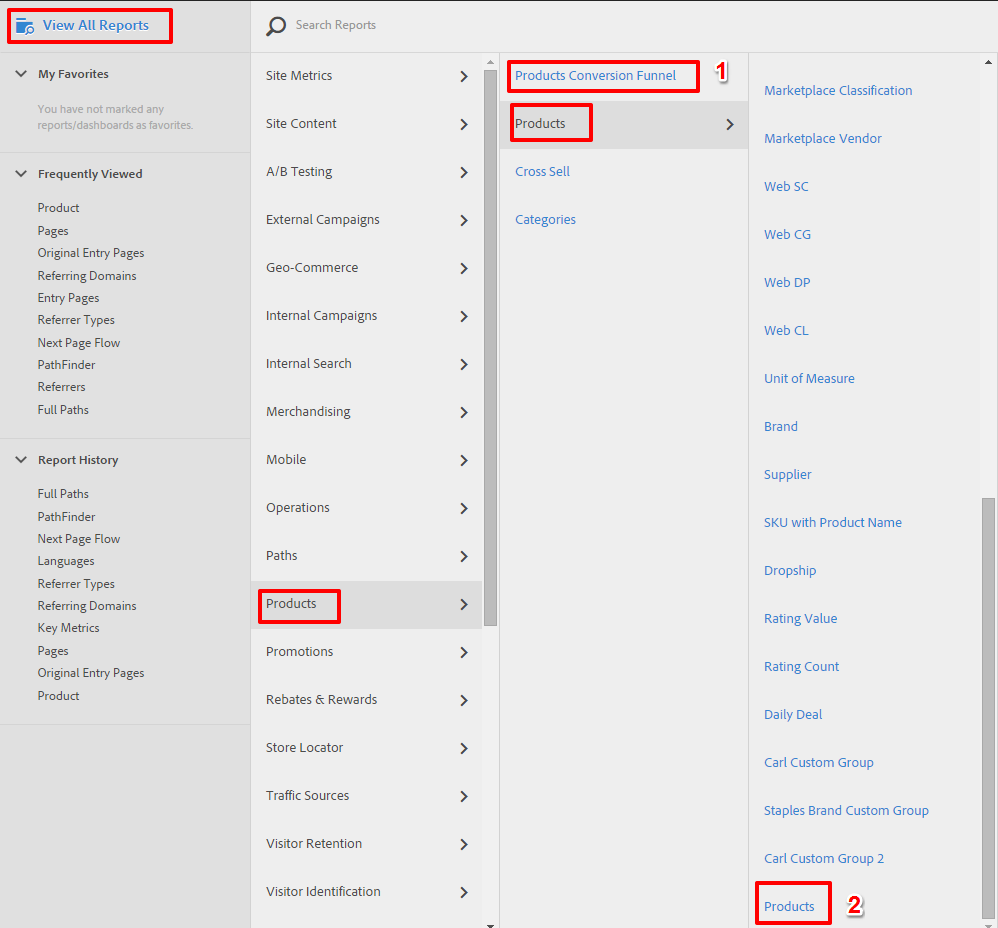
The first is the products conversion funnel, which does what it says on the tin – it’s a conversion funnel very much like the ones you’re used to seeing in Google Analytics. It also gives you percentages for order rate and average revenue for visitors who’ve reached various stages in the process.
The products report is interesting in that it gives you a full list of products and allows you to add various metrics, some of which are difficult to interpret and should be treated with caution – for example, what does “page views” mean for a product without a product page? At the very least, though, this report allows you to see which products generate the most revenue and orders.
Equivalent Reports Summary Table
If you’ve read this far, hopefully this post has been useful to you. I’ve summarised the main equivalent reports in a table below. Please feel free to contribute your feedback and tips in the comments section!
| GA Report | Omniture Equivalent | Omniture Navigation Path |
| Dashboards | Dashboards | 1) View All Reports
2) Dashboards |
| Acquisition Overview | Referrer Types | 1) View All Reports
2) Traffic Sources 3) Referrer Types |
| Audience Overview | Visitor Profile reports | 1) View All Reports
2) Visitor Profile |
| Audience Behaviour reports | Visitor Retention reports | 1) View All Reports
2) Visitor Retention |
| Landing Pages report | Entry Pages report | 1) View All Reports
2) Paths 3) Entries and Exits 4) Entry Pages |
| Site Speed reports | Performance reports | 1) View All Reports
2) Site Metrics 3) Performance 4) Page Load Time |
| User Flow report | Paths reports | 1) View All Reports
2) Paths 3) Pages 4) Next Page Flow / Previous Page Flow / PathFinder |
| Funnel Visualisation | Products Conversion Funnel | 1) View All Reports
2) Products 3) Products Conversion Funnel |
–


