Statistical significance for CRO
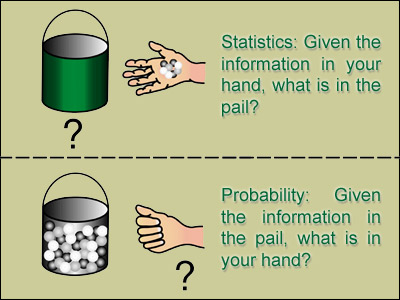
Statistical significance is all about whether the difference between two numbers is meaningful or just a fluke. In this post I’ll outline 6 things you need to know to make statistical significance for conversion rate A/B tests and broader analytics data.
1) Exactly what it means

“The variation achieved a 20% increase in conversions with 90% significance.” Unfortunately, this isn’t equivalent to, “there is a 90% chance of a 20% increase.” So what does it actually mean?
20% is the increase we observed in our sample, and, if we had to guess, it’s the increase we’d expect to see if we continued the test indefinitely. It’s the most likely outcome. But there is not a 90% chance of a 20% increase, or even a 90% chance of an increase of at least 20% or approximately 20%.
90% is the chance that we’d get a result less extreme than this one if, in fact, our control and our variation were identical. It’s easier to think about the flip side of this – that, had we been conducting a test of two identical versions, there’s a 10% chance we’d have gotten a result this extreme.
If we interpret this wrongly, we risk severe dissapointment when we roll a test out. It’s easy to get excited when a test manages a big improvement with 95% significance, but you’d be wise not to set your expectations too high.
2) When to use it
A/B split tests are the obvious candidate, but far from the only one. You can also test for statistically significant differences between segments (e.g. organic search visitors and paid search visitors) or time periods (e.g. April 2013 and April 2014).

Note, however, that correlation does not imply causation. With a split test, we know we can attribute any differences to the on-page changes because we’re being very careful to keep everything else constant. If you’re comparing groups like organic and paid search visitors, all sorts of other factors could be at work – for example, perhaps organic visitors are disproportionately likely to visit at night, and night-time visitors convert very well. Testing for significance establishes whether there is a significant difference, but it doesn’t tell you what caused that difference.
3) How to test changes in conversion rate, bounce rate or exit rate
When we’re looking a “rate”, we’re actually looking an average of a binary variable – for example; either someone converted, or they didn’t. If we have a sample of 10 people with an ecommerce conversion rate of 40%, we’re actually looking at a dataset something like this:
| Visitor # | Converted? |
| 1 | 0 |
| 2 | 1 |
| 3 | 0 |
| 4 | 0 |
| 5 | 1 |
| 6 | 0 |
| 7 | 1 |
| 8 | 1 |
| 9 | 0 |
| 10 | 0 |
| Average: | 0.4 = 40% |
We need this dataset as well as the average in order to calculate the standard deviation, which is a key component of statistical significance. However, the fact that every value in the dataset is either a 0 or a 1 makes things somewhat easier – a smart tool can save us the bother of copy-pasting a huge list of numbers by figuring out how many 0s and 1s we’re looking at, based on the average and the sample size. This tool by KissMetrics is a favourite at Distilled: http://getdatadriven.com/ab-significance-test
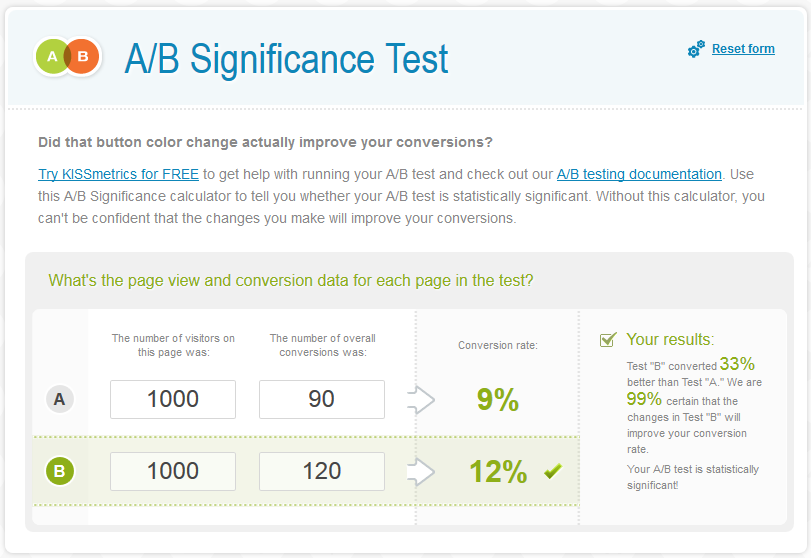
(Note that this tool uses a one-sided test, which we often recommend against. Read about the difference here. To convert the result to a two-sided significance, double the distance from 100% – for example, 95% one-sided becomes 90% two-sided.)
Although this is described as an A/B significance test tool, you could also use it for any other comparison of rates – just replace conversions with bounces or exits. Similarly, you could use it to compare segments or time periods – the maths is the same.
It’s also fine to use this when testing multiple variations – just test one variation versus the original at a time.
4) How to test changes in average order value
To test averages of non-binary variables, we need the full dataset, so things have to get slightly more complicated. For example, let’s say we wanted to test whether there was a significant difference in average order value for an A/B split-test – this is something that’s often ignored in ecommerce CRO, despite being just as important as conversion rate in its impact on a business’s bottom line.
The first thing we need to do is extract the full list of transactions for each cohort from Google Analytics. The easiest way to do this is to create segments based on the custom variables for your split test, and export the transactions report as an Excel spreadsheet. Make sure you get all of them – not just the default 10 rows.
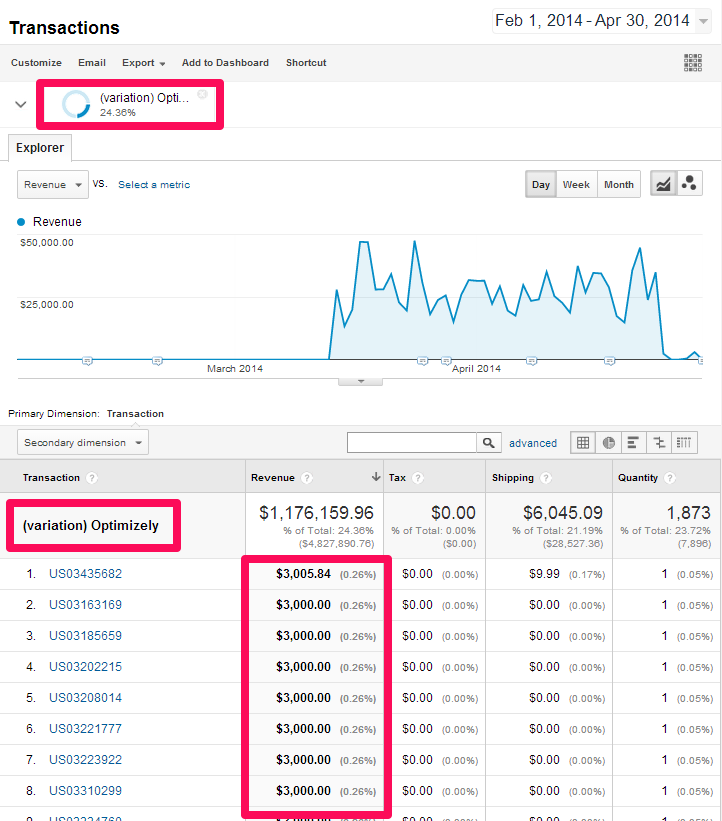
Once you have your two lists of transactions, you can copy them into a tool like this one: http://www.evanmiller.org/ab-testing/t-test.html
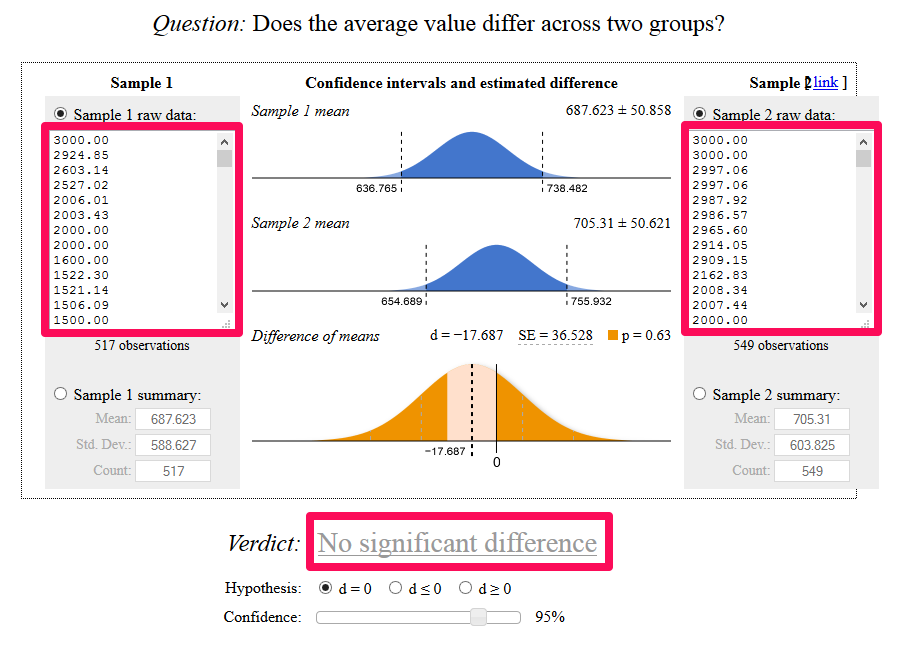
In the case shown above, we don’t have statistical significance at the chosen level of 95%. In fact, if we look at the p-value of 0.63 shown above the bottom graph, we don’t even have 50% significance – there’s a 63% chance that this difference is pure fluke.
5) How to anticipate the required duration of an A/B split-test
Evanmiller.org has another handy tool for CRO – a sample size calculator: http://www.evanmiller.org/ab-testing/sample-size.html
This tool lets you give an answer to the question “How long will it take to get significance?” that isn’t pure guesswork.
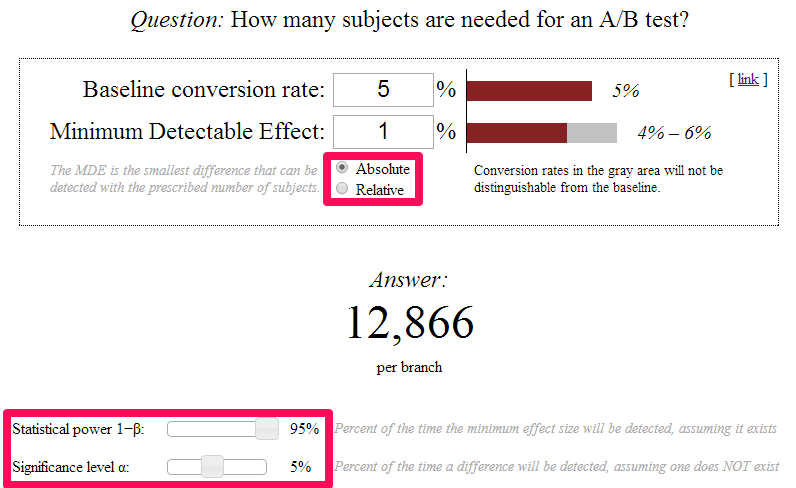
A few things are worth pointing out, however. Firstly, there’s the “absolute” vs. “relative” toggle – if you want to detect the difference between a 5% base conversion rate and a 6% variation conversion rate, that’s a 1% absolute effect (6-5=1), or a 20% relative effect (6/5=1.2). Secondly, there’s the two sliders at the bottom of the page. The bottom slider corresponds to your desired significance level – if you’re aiming for 95% significance, you should set the slider to 5%. The top slider shows the chance that the number of required visits shown will in fact be sufficient – for example, if you want an estimate of how many visits will be required for an 80% chance of detecting 95% significance, set the top slider at 80% and the bottom slider at 5%.
6) What not to do
There are a few easy ways to render a split-test invalid that sometimes aren’t immediately obvious:
a) A/B testing non-binary ordinal values
For example, you might want to test whether there is a significant difference between whether visitors in the original or variation groups buy certain products. You label your three products “1”, “2” and “3”, then enter those values into a significance test. Unfortunately, this doesn’t work – the average of product 1 and product 3 is not product 2.
b) Traffic allocation sliders

At the start of your test, you decide to play it safe and set your traffic allocation to 90/10. After a time, it seems the variation is non-disastrous, and you decide to move the slider to 50/50. But return visitors are still always assigned their original group, so now you have a situation where the original version has a larger proportion of return visitors, who are far more likely to convert. It all gets very complex very quickly, and the only simple way to get data you can be confident in is to look at new and returning visitors separately, so it now takes longer to achieve significance. And even if both sub-groups achieve significance, what if one was actually generating more return visitors? Don’t do this.
c) Scheduling
It sounds obvious, but don’t compare data collected at only one time of day with data collected either throughout the day or at some other time of day. If you want your test to run only at certain times of day, you have two options:
-
Bucket visitors in the same way throughout the day, but show “variation” visitors the original at the times of day you’re not interested in.
-
Compare apples with apples – if you’re only looking at variation data from the early afternoon, compare it with original data from the early afternoon.
Hopefully some of the above will prove useful in your CRO efforts.


